(MENAFN- Daily Forex) Bullish view
Buy the BTC/USD pair and set a take-profit at 70,000. Add a stop-loss at 65,000. Timeline: 1-2 days.
Bearish view
Set a sell-stop at 66,000 and a take-profit at 65,000. Add a stop-loss at 68,000.
Bitcoin price continued its uptrend this week amid rising demand from ordinary day traders and investors. The BTC/USD pair blasted past 67,000 for the first time since 2021 when it was heading to its all-time high. This rally happened in a day when American stocks pulled back sharply targets ATH
Bitcoin is slowly moving to its highest level on record amid soaring demand. This rally happened in the same day that gold surged to its all-time high of $2,100.
The performance is a sign that investors are turning to alternative assets as the stocks bull run continues. American indices like the S&P 500 and Nasdaq 100 have all surged to their all-time highs.
Bitcoin's performance happened as demand for Bitcoin ETFs continued surging. The most recent data shows that the total assets in the highly popular iShares Bitcoin ETF (IBIT) have surged to over $10 billion in less than two months. Other popular ETFs like those from Fidelity and Franklin Templeton have all seen increased inflows.
Forex Brokers We Recommend in Your Region See full brokers list 1 Read full review Get Started
All this is happening at a time when Bitcoin is preparing for the halving event, which is set to happen in April. Halving is a process that happens every four years in which the amount of Bitcoin rewards is slashed by half.
It helps to make mining difficult with the goal of reducing the amount of Bitcoins supplied to the market. Bitcoin tends to rally ahead of these halving events.
This halving, in particular, is unique than those that happened a few years before. It is happening at a time when there is strong institutional demand for Bitcoins following the SEC's decision to approve eleven ETFs.
Further, this halving is happening as the Federal Reserve prepares to cut interest rates . Most analysts expect the rate cuts to start in May or June/USD technical analysis
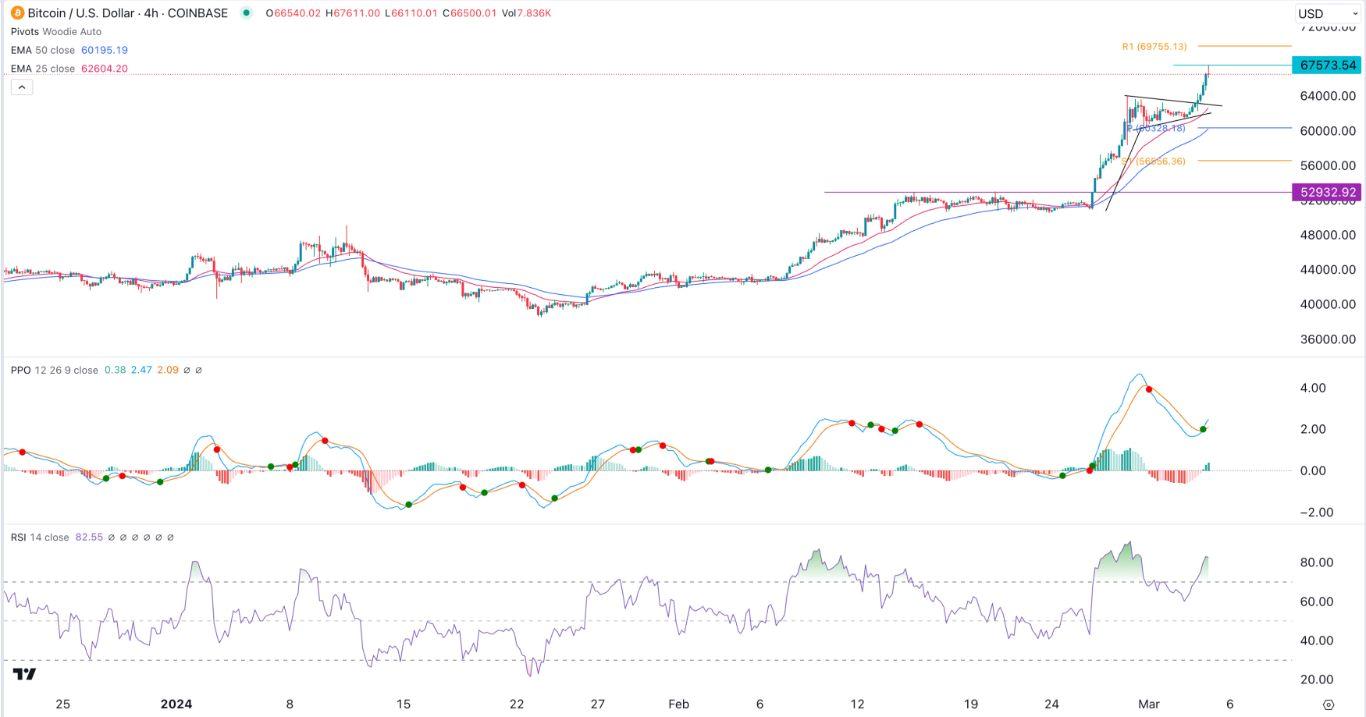
The BTC/USD pair continued soaring this week as Bitcoin's demand rose. It moved above the bullish pennant pattern that had been forming since last week.
The pair has also jumped above all moving averages and the Woodie Pivot Point . It has also moved sharply above the Ichimoku cloud indicator .
Meanwhile, the Relative Strength Index (RSI) has moved to the extremely overbought level of 80 while the PPO indicator remains above the neutral point.
Therefore, the outlook for the pair is bullish as bulls target the important resistance point at 70,000. The stop-loss of this trade is at 65,000.
Ready to trade our daily Forex signals ? Here's a list of some of the best crypto brokers to check out.
MENAFN05032024000131011023ID1107935833
Legal Disclaimer:
MENAFN provides the information “as is” without warranty of any kind. We do not accept any responsibility or liability for the accuracy, content, images, videos, licenses, completeness, legality, or reliability of the information contained in this article. If you have any complaints or copyright issues related to this article, kindly contact the provider above.