(MENAFN- Daily Forex) Fundamental Analysis & market Sentiment
I wrote on 4th February that the best trade opportunities for the week were likely to be:
Long of the
nasdaq 100
index following a daily close above 17686. This gave a win of 1.03%.
Long of the
S&P 500 Index . This gave a win of 1.45%.
Long of Cocoa Futures . This gave a win of 11.20%.
Long of USD/JPY and/or EUR/JPY following a bullish bounce at key support. This set up in EUR/JPY with the bounce off 159.00, giving a very profitable trade.
Short of AUD/USD following a bearish rejection at key resistance. This did not set up.
The overall result was a gain of at least 13.68%, which comes to an excellent gain of 4.56% per asset. Last week saw slightly higher directional volatility in the Forex market , with 15% of significant currency pairs fluctuating by more than 1%. There was important action in US stock markets. Last week again saw new all-time high prices reached by the benchmark S&P 500 Index, the Nasdaq 100 Index, and the Dow Jones 30 Index. This rise in stock markets occurred despite the CME's FedWatch tool showing strongly lowering expectations of a March rate cut by the Federal Reserve . Markets now see only a 16% chance of a rate cut in March, down from 38% one week ago. However, there is a strong expectation of a rate cut at the next meeting in May.
Last week's agenda was relatively light, dominated by Fed Chair Jerome Powell's interview and the Reserve Bank of Australia's policy meeting, both of which came early in the week. Powell said that a March rate cut was "unlikely", which helped lower expectations of a possible cut next month, boosting the US Dollar. The Reserve Bank of Australia left its rate unchanged as widely expected but made a hawkish tilt in its statement by casting doubt on rate cuts , which boosted the Australian Dollar somewhat.
The Forex market was dominated by a strong New Zealand Dollar, while the Swiss Franc was the weakest major currency. The US Dollar is showing weak short-term bullish momentum and has now established a new long-term bullish trend by the indicator I like to use, but it looks very fragile – much will likely depend upon key US CPI (inflation) data, which will be released this Tuesday were several other important economic data releases last week:
US ISM Services PMI – this came in above expectations, pointing to continuing strength in the US economy.
Governor of Bank of Canada Speaks – he pushed back on near-term rate cuts, pointing to fewer rate cuts in 2024 than were expected.
New Zealand Unemployment Rate – employment growth in New Zealand was notably stronger than expected, helping to strengthen the New Zealand Dollar.
US Unemployment Claims – this came in almost exactly as expected.
Canadian Unemployment Rate - employment growth in Canada was notably stronger than expected, helping keep the Canadian Dollar relatively firm.
Forex Brokers We Recommend in Your Region See full brokers list 1 Read full review Get Started The Week Ahead: 12th – 16th February
The most important item over the coming week will almost certainly be the US CPI (inflation) data release. Next week has a relatively heavy data schedule.
Other major economic data releases this week will be, in likely order of importance:
US PPI
US Retail Sales
US Preliminary UoM Consumer Sentiment
UK CPI (inflation)
Swiss CPI (inflation)
UK GDP
US Unemployment Claims
US Empire State Manufacturing Index
UK Retail Sales
New Zealand Inflation Expectations
UK Claimant Count Change (Unemployment Claims)
Australian Unemployment Rate
The Governor of the Bank of England will be giving two minor speeches.
Monday will be a public holiday in Japan. In China, the whole week will be a public holiday Forecast February 2024

For the month of February, I made no monthly forecast, as there was no obvious long-term trend in the US Dollar that can be relied upon Forecast 12th February 2024
Last week, I made no weekly forecast, as there were no strong counter-trend price movements in any currency crosses, which is the basis of my weekly trading strategy.
I again give no forecast this week.
Directional volatility in the Forex market remained the same last week, with only 4% of the most important currency pairs fluctuating by more than 1%. Volatility is likely to increase over the coming week, as such a low level of volatility is unusual for more than a few weeks. There is also quite a heavy, high-impact economic data release schedule this week.
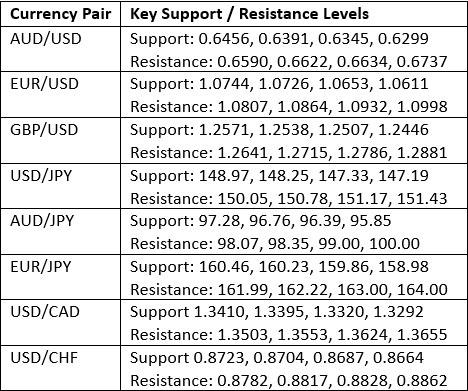
Last week saw relative strength in the Swiss Franc and relative weakness in the Euro. You can trade these forecasts in a real or demo Forex brokerage account .Key Support/Resistance Levels for Popular Pairs
Technical AnalysisUS Dollar Index
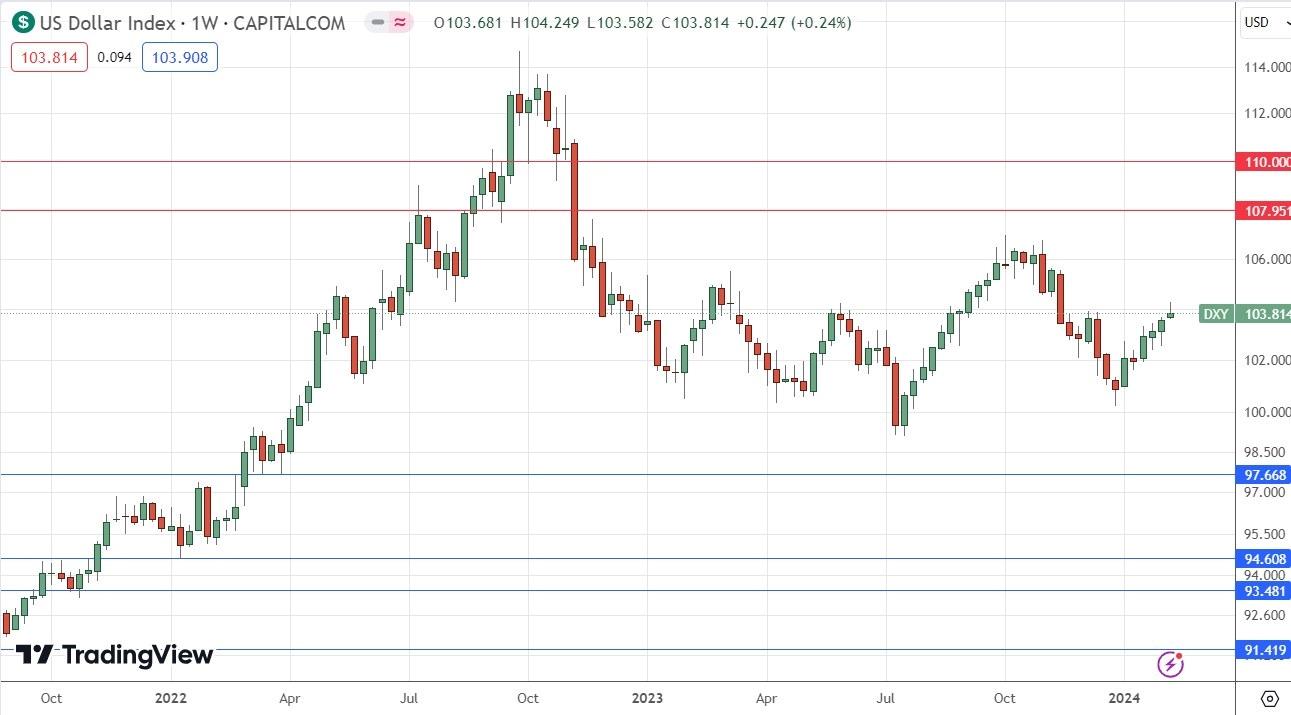
The US Dollar Index printed a candlestick which closed above its open last week, but it is arguably a small bearish pin bar. However, the weekly close was up on the price of 3 months ago and 6 months ago, presenting a new bullish long-term trend.
Despite this new bullish trend in the greenback, I think the direction still looks uncertain. Much will likely depend on this Tuesday's release of US CPI (inflation) data. If inflation is dropping faster than expected, it will probably trigger a selloff. If inflation proves persistently high, the Dollar will probably begin to rise with real momentum as expectations for a first rate cut in May would lower.
NASDAQ 100 Index
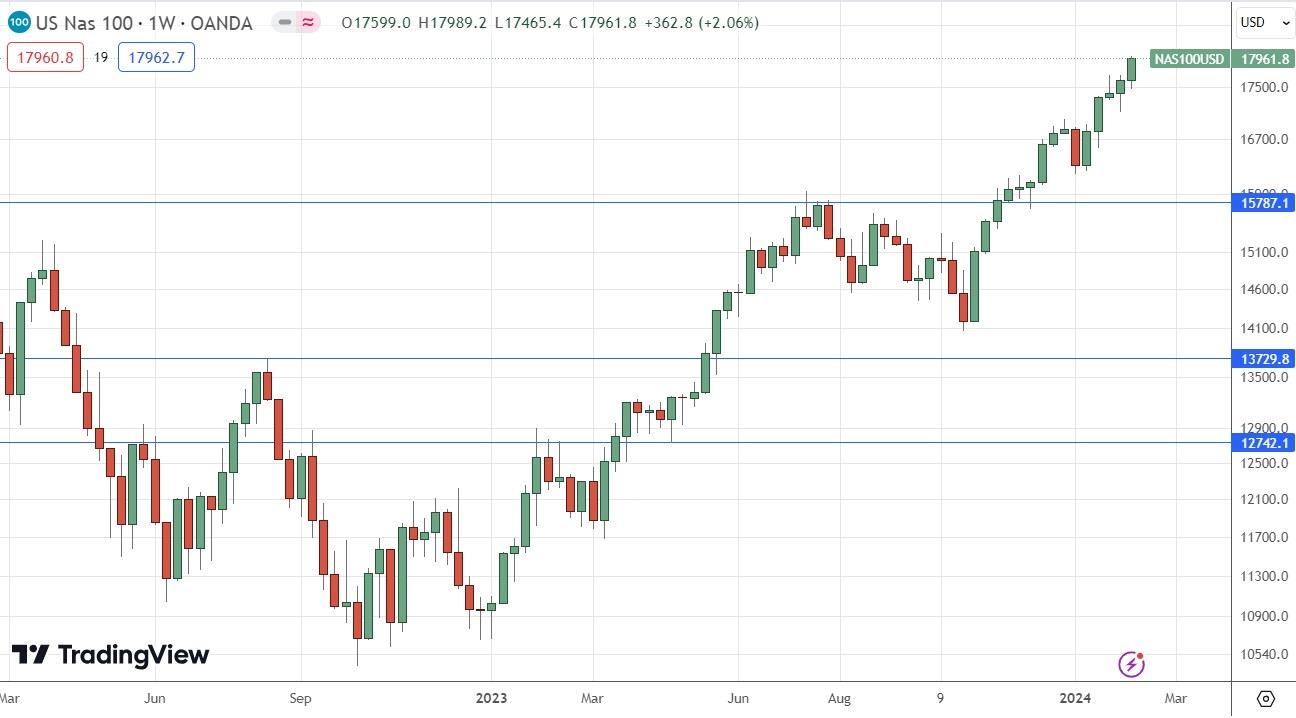
The NASDAQ 100 Index rose firmly last week to reach a new record high price . Its closing price was right on the high of the week. These are bullish signs, supported by the fact that the S&P 500 and Dow Jones 30 Indices also made record highs last week.
Although the Federal Reserve seems to be in no hurry to cut rates, with expectations of cuts decreasing, this is not slowing the advance of US stock markets through blue sky. I am happy to be long of the NASDAQ 100 Index, which has a much better historical record than the S&P 500 Index.
S&P 500 Index
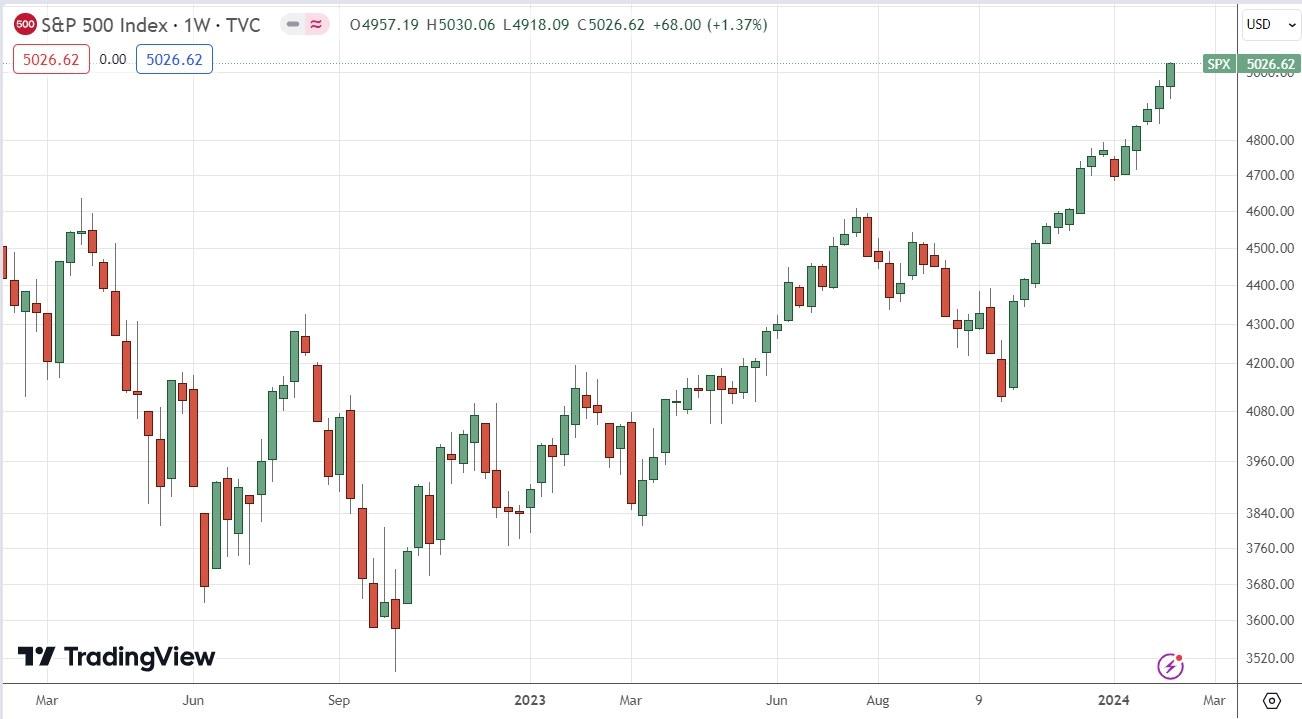
The S&P 500 Index again rose firmly last week to reach and close at a new record high. The price closed right on the high of the week. These are bullish signs. This bullishness in US stock markets is a bit counter-intuitive as it comes at the same time as short-term US treasury yields and the US Dollar are rising in value, while expectations of a rate cut by the Federal Reserve in March are continuing to fall even lower over the past week. These factors typically weaken US stock markets. It may be that the US economy is just looking so much more impressive than its competitors right now that an inflow of foreign investment is coming into the US stock market.
I see the S&P 500 Index as a buy.
The technical picture is bullish. A first break to a fresh all-time high has historically generated an advance of a median of 13% over the next year, so traders and investors should be seriously considering going long here.
Bitcoin
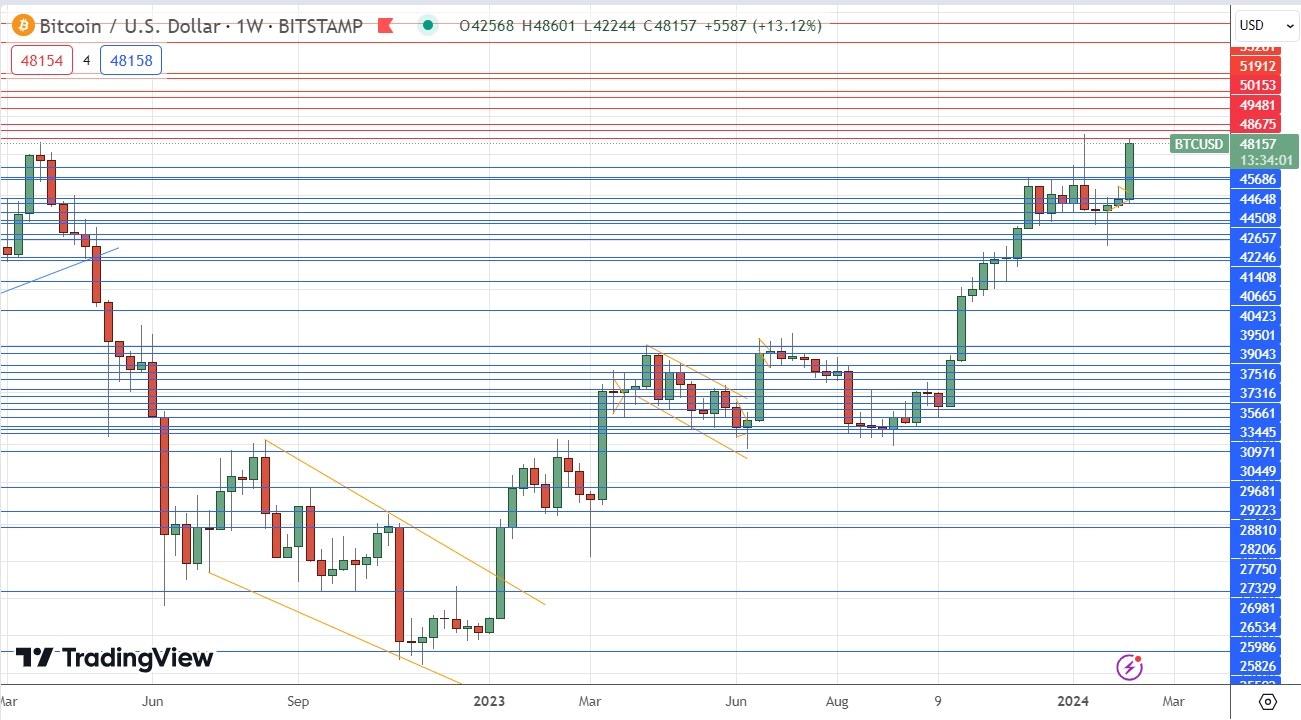
After consolidating for several weeks, Bitcoin has made a firm bullish breakout but has not yet exceeded the recent high made a few weeks ago when Bitcoin ETFs were securing regulatory approval. The price today is very near the high of the past week's range, which is a bullish sign.
However, despite these bullish signs, I would like to see Bitcoin make a daily close above $50,000 before entering a long-term investment here. I am concerned about the recent high just above $49k and the big round number at $50k acting as resistance.
GBP/USD
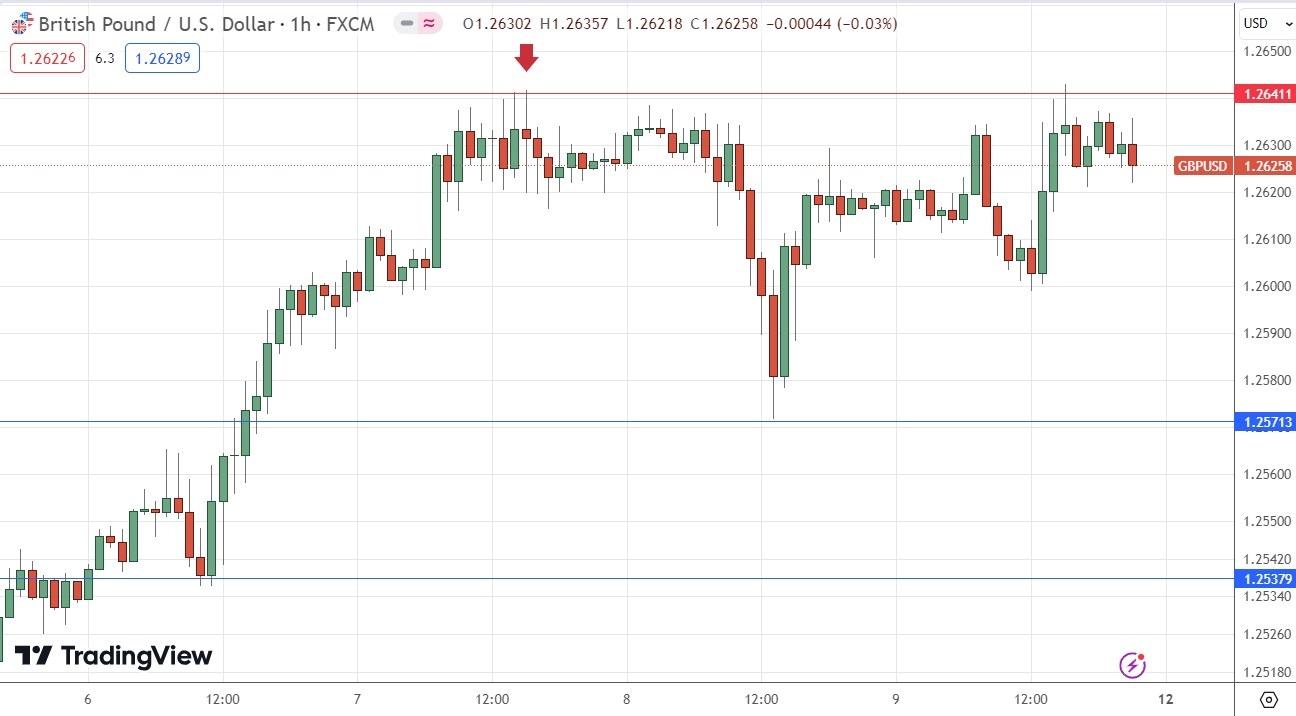
I had expected the level at $1.2641 might act as resistance in the GBP/USD currency pair last week , as this price has acted previously as both support and resistance . Note how these“role reversal” levels can work well. The H1 price chart below shows how the price rejected the resistance level during last Wednesday's London / New York sessions overlap with a doji, marked by the down arrow in the price chart below, signalling the timing of this bearish rejection. This can be a great time of the day to trade a major Forex currency pair like this one. This trade was profitable, giving a maximum reward-to-risk ratio of more than 2 to 1 based on the entry candlestick.
EUR/JPY
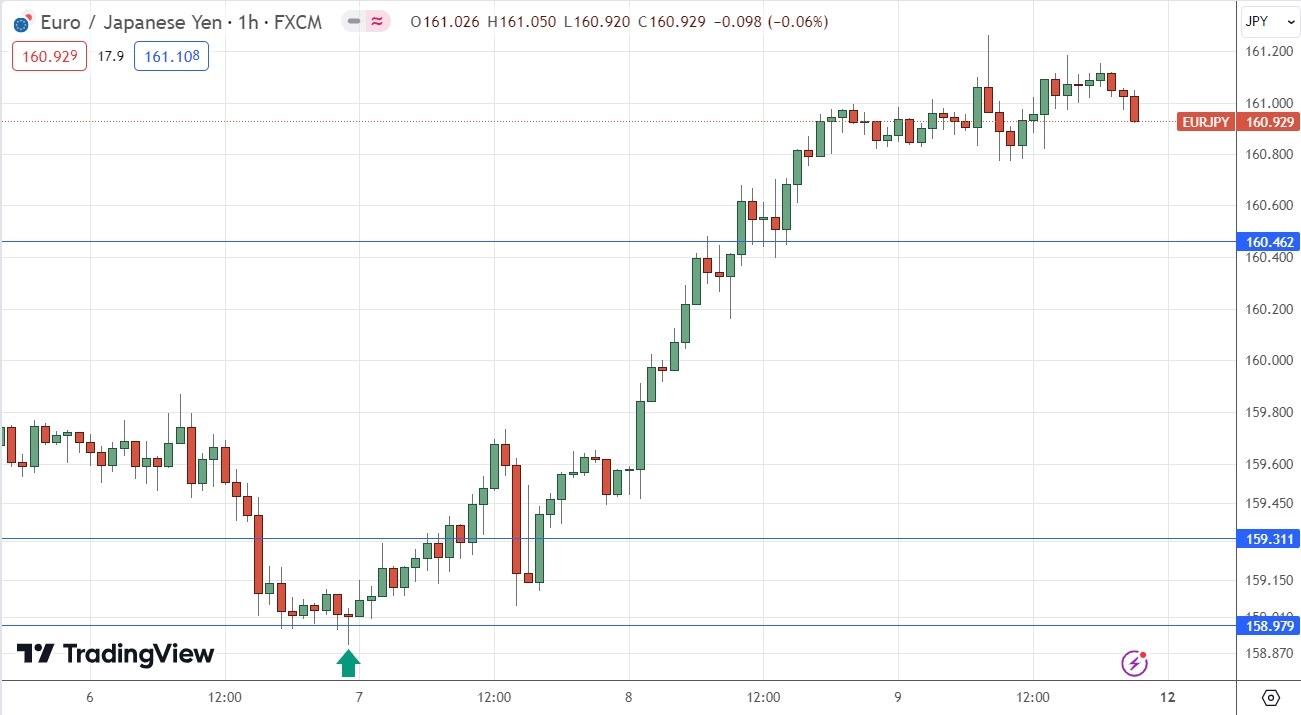
I had expected the level of ¥158.98 might act as support . The H1 price chart below shows how this level was rejected repeatedly during last Tuesday's New York session, marked by the up arrow in the price chart below, signalling the timing of this bullish rejection. It took several hours, but then the start of the Tokyo session finally saw the decisive rejection by a pin bar – it is common to see decisive rejections at the start or close of major and relevant geographical sessions in the Forex market.
This trade has been extremely profitable, giving a maximum reward-to-risk ratio of more than 10 to 1 based on the size of the entry candlestick.
Note that the Yen is showing some relative weakness, so this currency pair and others may be good vehicles to use to take advantage of that. If the US CPI is higher than expected, the USD/JPY currency pair will be very likely to rise, so that could be attractive in the long run.
Cocoa Futures
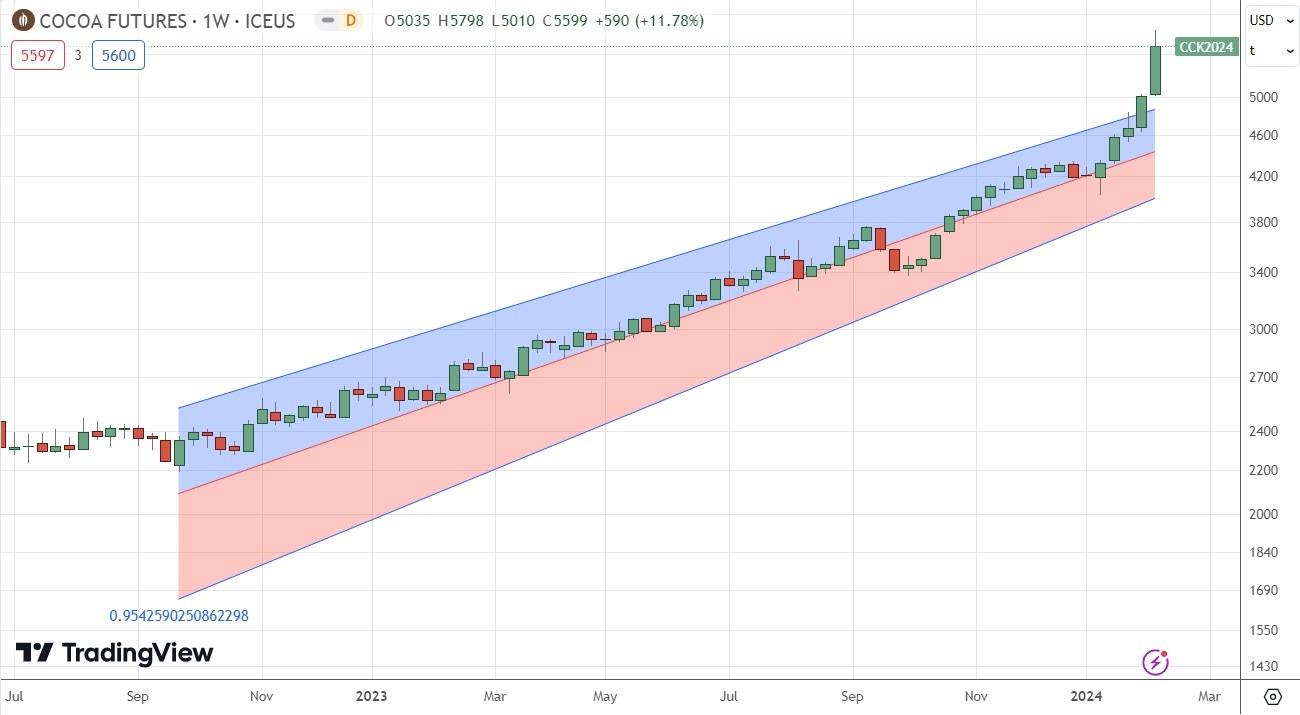
Cocoa futures have been in a strong bullish trend for over a year, and last week, the price advanced extremely strongly to reach a new multi-year high price, rising by more than 11% over the week. The price chart below applies linear regression analysis to the past 73 weeks and shows graphically what a great opportunity this has been on the long side over the long term.
Despite this very bullish picture, there are some muted notes of caution:
The price is way above the linear regression channel.
Volatility is extremely high, and Cocoa is getting a lot of media attention.
These factors suggest a sharp dip may be coming soon, making it a bit dangerous to enter a long trade blindly here.
Trading commodities long on breakouts to new 6-month highs has been a very profitable strategy over recent years, so I see this as a buy. However, it is worth waiting for a daily close above the recent high to be sure the extremely high volatility is not a sign of this trend ending, as it often can be.
Bottom Line
I see the best trading opportunities this week as:
Long of the NASDAQ 100 Index. Long of the S&P 500 Index. Long of Bitcoin following a daily close above $50,000. Long of Cocoa Futures following a daily close above 5800. Ready to trade our weekly Forex forecast ? Here are the best Forex brokers to choose from.
MENAFN12022024000131011023ID1107840401