(MENAFN- PR Newswire)
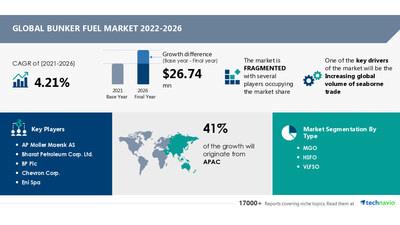
NEW YORK, May 13, 2022 /PRNewswire/ -- The bunker fuel market potential growth difference will be USD 26.74 million from 2021 to 2026, and the market's growth is anticipated to accelerate at a CAGR of 4.21%.
Our market analysis report on the 'Bunker Fuel Market by Type and Geography - Forecast and Analysis 2022-2026 ' covers complete analysis including vendor strategies, current market scenario, and latest trends and drivers.
Technavio has announced its latest market research report titled Bunker Fuel Market by Type and Geography - Forecast and Analysis 2022-2026
Key vendors insights
The bunker fuel market is fragmented and the vendors are deploying organic and inorganic growth strategies to compete in the market. The global bunker fuel market is expected to grow considerably during the forecast period due to the growing maritime industry.
Some of the key market vendors are:
- AP Moller Maersk AS
- Bharat Petroleum Corp. Ltd.
- BP Plc
- Chevron Corp.
- Eni Spa
- Equatorial Marine Fuel Management Services Pte. Ltd.
- Exxon Mobil Corp.
- Glencore Plc
- Global Energy International Ltd.
- Hindustan Petroleum Corp. Ltd.
- Indian Oil Corp. Ltd.
- Marquard and Bahls AG
- Neste Corp.
- Phillips 66
- PJSC Gazprom Neft
- PJSC LUKOIL
- Rosneft Oil Co.
- SENTEK Marine Pte. Ltd.
- Shell plc
- SK B and T Pte. Ltd.
- TotalEnergies SE
- Toyota Tsusho Corp.
Product News and Vendor insights
- Bharat Petroleum Corp. Ltd. : The company offers bunker fuel products such as very low Sulphur oil under Marine oil. Under the downstream petroleum segment, the company focuses on the refining and marketing of petroleum products.
- BP Plc : The company offers bunker fuel services such as Marine fuels.
- Chevron Corp .: The company offers bunker fuel products under the Marine such as HDAX 9700.
For more detailed highlights on products offerings and the growth strategies adopted by the vendors, Download sample report
Parent Market Outlook
Technavio categorizes the global bunker fuel market as a part of the global specialty chemicals market. Our research report has extensively covered external factors influencing the parent market growth potential in the coming years, which will determine the levels of growth of the bunker fuel market during the forecast period.
Bunker fuel market trend
- Development of scrubber technology Shipping companies are increasingly adopting exhaust gas cleaning technologies, such as marine scrubbers to comply with the stringent emission norms. Marine scrubber systems remove most of the sulfur oxides and particulate matter from the exhaust gases released by vessels by spraying them with seawater or seawater mixed with caustic soda. The increasing installation of marine scrubbers, which is one of the critical bunker fuel market trends, will allow the use of high-sulfur bunker fuel and consequently, drive the growth of the market throughout the next five years.
Revenue-generating Regional Highlights
41% of the market's growth will originate from APAC during the forecast period. China is the key market for bunker fuel in APAC. Market growth in this region will be faster than the growth of the market in the North American and MEA regions. The increasing demand for energy and growth in seaborne trade in the region will facilitate the bunker fuel market growth in APAC over the forecast period.
Get sample report for extensive insights on key market Drivers, Trends and Challenges influencing the bunker fuel market
Related Reports:-
Wind Turbine Gear Oil Market by Product, Application, and Geography - Forecast and Analysis 2020-2024
LNG-as-a-fuel Market by End-user and Geography - Forecast and Analysis 2022-2026
Do reach out to our analysts for more customized reports as per needs. Speak to our Analyst now!
| Bunker fuel Market Scope |
| Report Coverage | Details |
| Page number | 120 |
| Base year | 2021 |
| Forecast period | 2022-2026 |
| Growth momentum & CAGR | Accelerate at a CAGR of 4.21% |
| Market growth 2022-2026 | $ 26.74 million |
| Market structure | Fragmented |
| YoY growth (%) | 3.99 |
| Regional analysis | APAC, Europe, Middle East and Africa, North America, and South America |
| Performing market contribution | APAC at 41% |
| Key consumer countries | US, United Arab Emirates, China, Germany, and France |
| Competitive landscape | Leading companies, Competitive strategies, Consumer engagement scope |
| Key companies profiled | AP Moller Maersk AS, Bharat Petroleum Corp. Ltd., BP Plc, Chevron Corp., Eni Spa, Equatorial Marine Fuel Management Services Pte. Ltd., Exxon Mobil Corp., Glencore Plc, Global Energy International Ltd., Hindustan Petroleum Corp. Ltd., Indian Oil Corp. Ltd., Marquard and Bahls AG, Neste Corp., Phillips 66, PJSC Gazprom Neft, PJSC LUKOIL, Rosneft Oil Co., SENTEK Marine Pte. Ltd., Shell plc, SK B and T Pte. Ltd., TotalEnergies SE, and Toyota Tsusho Corp. |
| Market dynamics | Parent market analysis, Market growth inducers and obstacles, Fast-growing and slow-growing segment analysis, COVID 19 impact and recovery analysis and future consumer dynamics, Market condition analysis for the forecast period |
| Customization purview | If our report has not included the data that you are looking for, you can reach out to our analysts and get segments customized. |
Table of Content
1 Executive Summary
- 1.1 Market overview
- Exhibit 01: Executive Summary – Chart on Market Overview
- Exhibit 02: Executive Summary – Data Table on Market Overview
- Exhibit 03: Executive Summary – Chart on Global Market Characteristics
- Exhibit 04: Executive Summary – Chart on Market by Geography
- Exhibit 05: Executive Summary – Chart on Market Segmentation by Type
- Exhibit 06: Executive Summary – Chart on Incremental Growth
- Exhibit 07: Executive Summary – Data Table on Incremental Growth
- Exhibit 08: Executive Summary – Chart on Vendor Market Positioning
2 Market Landscape
- 2.1 Market ecosystem
- Exhibit 09: Parent market
- Exhibit 10: Market Characteristics
3 Market Sizing
- 3.1 Market definition
- Exhibit 11: Offerings of vendors included in the market definition
- 3.2 Market segment analysis
- Exhibit 12: Market segments
- 3.4 Market outlook: Forecast for 2021-2026
- Exhibit 13: Chart on Global - Market size and forecast 2021-2026 ($ million)
- Exhibit 14: Data Table on Global - Market size and forecast 2021-2026 ($ million)
- Exhibit 15: Chart on Global Market: Year-over-year growth 2021-2026 (%)
- Exhibit 16: Data Table on Global Market: Year-over-year growth 2021-2026 (%)
4 Five Forces Analysis
- 4.1 Five forces summary
- Exhibit 17: Five forces analysis - Comparison between2021 and 2026
- 4.2 Bargaining power of buyers
- Exhibit 18: Chart on Bargaining power of buyers – Impact of key factors 2021 and 2026
- 4.3 Bargaining power of suppliers
- Exhibit 19: Bargaining power of suppliers – Impact of key factors in 2021 and 2026
- 4.4 Threat of new entrants
- Exhibit 20: Threat of new entrants – Impact of key factors in 2021 and 2026
- 4.5 Threat of substitutes
- Exhibit 21: Threat of substitutes – Impact of key factors in 2021 and 2026
- 4.6 Threat of rivalry
- Exhibit 22: Threat of rivalry – Impact of key factors in 2021 and 2026
- 4.7 Market condition
- Exhibit 23: Chart on Market condition - Five forces 2021 and 2026
5 Market Segmentation by Type
- 5.1 Market segments
- Exhibit 24: Chart on Type - Market share 2021-2026 (%)
- Exhibit 25: Data Table on Type - Market share 2021-2026 (%)
- 5.2 Comparison by Type
- Exhibit 26: Chart on Comparison by Type
- Exhibit 27: Data Table on Comparison by Type
- 5.3 MGO - Market size and forecast 2021-2026
- Exhibit 28: Chart on MGO - Market size and forecast 2021-2026 ($ million)
- Exhibit 29: Data Table on MGO - Market size and forecast 2021-2026 ($ million)
- Exhibit 30: Chart on MGO - Year-over-year growth 2021-2026 (%)
- Exhibit 31: Data Table on MGO - Year-over-year growth 2021-2026 (%)
- 5.4 HSFO - Market size and forecast 2021-2026
- Exhibit 32: Chart on HSFO - Market size and forecast 2021-2026 ($ million)
- Exhibit 33: Data Table on HSFO - Market size and forecast 2021-2026 ($ million)
- Exhibit 34: Chart on HSFO - Year-over-year growth 2021-2026 (%)
- Exhibit 35: Data Table on HSFO - Year-over-year growth 2021-2026 (%)
- 5.5 VLFSO - Market size and forecast 2021-2026
- Exhibit 36: Chart on VLFSO - Market size and forecast 2021-2026 ($ million)
- Exhibit 37: Data Table on VLFSO - Market size and forecast 2021-2026 ($ million)
- Exhibit 38: Chart on VLFSO - Year-over-year growth 2021-2026 (%)
- Exhibit 39: Data Table on VLFSO - Year-over-year growth 2021-2026 (%)
- 5.6 Market opportunity by Type
- Exhibit 40: Market opportunity by Type ($ million)
6 Customer Landscape
- 6.1 Customer landscape overview
- Exhibit 41: Analysis of price sensitivity, lifecycle, customer purchase basket, adoption rates, and purchase criteria
7 Geographic Landscape
- 7.1 Geographic segmentation
- Exhibit 42: Chart on Market share by geography 2021-2026 (%)
- Exhibit 43: Data Table on Market share by geography 2021-2026 (%)
- 7.2 Geographic comparison
- Exhibit 44: Chart on Geographic comparison
- Exhibit 45: Data Table on Geographic comparison
- 7.3 APAC - Market size and forecast 2021-2026
- Exhibit 46: Chart on APAC - Market size and forecast 2021-2026 ($ million)
- Exhibit 47: Data Table on APAC - Market size and forecast 2021-2026 ($ million)
- Exhibit 48: Chart on APAC - Year-over-year growth 2021-2026 (%)
- Exhibit 49: Data Table on APAC - Year-over-year growth 2021-2026 (%)
- 7.4 Europe - Market size and forecast 2021-2026
- Exhibit 50: Chart on Europe - Market size and forecast 2021-2026 ($ million)
- Exhibit 51: Data Table on Europe - Market size and forecast 2021-2026 ($ million)
- Exhibit 52: Chart on Europe - Year-over-year growth 2021-2026 (%)
- Exhibit 53: Data Table on Europe - Year-over-year growth 2021-2026 (%)
- 7.5 Middle East and Africa - Market size and forecast 2021-2026
- Exhibit 54: Chart on Middle East and Africa - Market size and forecast 2021-2026 ($ million)
- Exhibit 55: Data Table on Middle East and Africa - Market size and forecast 2021-2026 ($ million)
- Exhibit 56: Chart on Middle East and Africa - Year-over-year growth 2021-2026 (%)
- Exhibit 57: Data Table on Middle East and Africa - Year-over-year growth 2021-2026 (%)
- 7.6 North America - Market size and forecast 2021-2026
- Exhibit 58: Chart on North America - Market size and forecast 2021-2026 ($ million)
- Exhibit 59: Data Table on North America - Market size and forecast 2021-2026 ($ million)
- Exhibit 60: Chart on North America - Year-over-year growth 2021-2026 (%)
- Exhibit 61: Data Table on North America - Year-over-year growth 2021-2026 (%)
- 7.7 South America - Market size and forecast 2021-2026
- Exhibit 62: Chart on South America - Market size and forecast 2021-2026 ($ million)
- Exhibit 63: Data Table on South America - Market size and forecast 2021-2026 ($ million)
- Exhibit 64: Chart on South America - Year-over-year growth 2021-2026 (%)
- Exhibit 65: Data Table on South America - Year-over-year growth 2021-2026 (%)
- 7.8 China - Market size and forecast 2021-2026
- Exhibit 66: Chart on China - Market size and forecast 2021-2026 ($ million)
- Exhibit 67: Data Table on China - Market size and forecast 2021-2026 ($ million)
- Exhibit 68: Chart on China - Year-over-year growth 2021-2026 (%)
- Exhibit 69: Data Table on China - Year-over-year growth 2021-2026 (%)
- 7.9 US - Market size and forecast 2021-2026
- Exhibit 70: Chart on US - Market size and forecast 2021-2026 ($ million)
- Exhibit 71: Data Table on US - Market size and forecast 2021-2026 ($ million)
- Exhibit 72: Chart on US - Year-over-year growth 2021-2026 (%)
- Exhibit 73: Data Table on US - Year-over-year growth 2021-2026 (%)
- 7.10 Germany - Market size and forecast 2021-2026
- Exhibit 74: Chart on Germany - Market size and forecast 2021-2026 ($ million)
- Exhibit 75: Data Table on Germany - Market size and forecast 2021-2026 ($ million)
- Exhibit 76: Chart on Germany - Year-over-year growth 2021-2026 (%)
- Exhibit 77: Data Table on Germany - Year-over-year growth 2021-2026 (%)
- 7.11 France - Market size and forecast 2021-2026
- Exhibit 78: Chart on France - Market size and forecast 2021-2026 ($ million)
- Exhibit 79: Data Table on France - Market size and forecast 2021-2026 ($ million)
- Exhibit 80: Chart on France - Year-over-year growth 2021-2026 (%)
- Exhibit 81: Data Table on France - Year-over-year growth 2021-2026 (%)
- 7.12 United Arab Emirates - Market size and forecast 2021-2026
- Exhibit 82: Chart on United Arab Emirates - Market size and forecast 2021-2026 ($ million)
- Exhibit 83: Data Table on United Arab Emirates - Market size and forecast 2021-2026 ($ million)
- Exhibit 84: Chart on United Arab Emirates - Year-over-year growth 2021-2026 (%)
- Exhibit 85: Data Table on United Arab Emirates - Year-over-year growth 2021-2026 (%)
- 7.13 Market opportunity by geography
- Exhibit 86: Market opportunity by geography ($ million)
8 Drivers, Challenges, and Trends
- 8.3 Impact of drivers and challenges
- Exhibit 87: Impact of drivers and challenges in 2021 and 2026
9 Vendor Landscape
- 9.2 Vendor landscape
- Exhibit 88: Overview on Criticality of inputs and Factors of differentiation
- 9.3 Landscape disruption
- Exhibit 89: Overview on factors of disruption
- 9.4 Industry risks
- Exhibit 90: Impact of key risks on business
10 Vendor Analysis
- 10.1 Vendors covered
- Exhibit 91: Vendors covered
- 10.2 Market positioning of vendors
- Exhibit 92: Matrix on vendor position and classification
- 10.3 Bharat Petroleum Corp. Ltd.
- Exhibit 93: Bharat Petroleum Corp. Ltd. - Overview
- Exhibit 94: Bharat Petroleum Corp. Ltd. - Business segments
- Exhibit 95: Bharat Petroleum Corp. Ltd. - Key offerings
- Exhibit 96: Bharat Petroleum Corp. Ltd. - Segment focus
- 10.4 BP Plc
- Exhibit 97: BP Plc - Overview
- Exhibit 98: BP Plc - Business segments
- Exhibit 99: BP Plc - Key offerings
- Exhibit 100: BP Plc - Segment focus
- 10.5 Chevron Corp.
- Exhibit 101: Chevron Corp. - Overview
- Exhibit 102: Chevron Corp. - Business segments
- Exhibit 103: Chevron Corp. - Key news
- Exhibit 104: Chevron Corp. - Key offerings
- Exhibit 105: Chevron Corp. - Segment focus
- 10.6 Eni Spa
- Exhibit 106: Eni Spa - Overview
- Exhibit 107: Eni Spa - Business segments
- Exhibit 108: Eni Spa - Key offerings
- Exhibit 109: Eni Spa - Segment focus
- 10.7 Exxon Mobil Corp.
- Exhibit 110: Exxon Mobil Corp. - Overview
- Exhibit 111: Exxon Mobil Corp. - Business segments
- Exhibit 112: Exxon Mobil Corp. - Key offerings
- Exhibit 113: Exxon Mobil Corp. - Segment focus
- 10.8 Indian Oil Corp. Ltd.
- Exhibit 114: Indian Oil Corp. Ltd. - Overview
- Exhibit 115: Indian Oil Corp. Ltd. - Business segments
- Exhibit 116: Indian Oil Corp. Ltd. - Key offerings
- Exhibit 117: Indian Oil Corp. Ltd. - Segment focus
- 10.9 Marquard and Bahls AG
- Exhibit 118: Marquard and Bahls AG - Overview
- Exhibit 119: Marquard and Bahls AG - Product / Service
- Exhibit 120: Marquard and Bahls AG - Key offerings
- 10.10 Rosneft Oil Co.
- Exhibit 121: Rosneft Oil Co. - Overview
- Exhibit 122: Rosneft Oil Co. - Business segments
- Exhibit 123: Rosneft Oil Co. - Key offerings
- Exhibit 124: Rosneft Oil Co. - Segment focus
- 10.11 Shell plc
- Exhibit 125: Shell plc - Overview
- Exhibit 126: Shell plc - Business segments
- Exhibit 127: Shell plc - Key news
- Exhibit 128: Shell plc - Key offerings
- Exhibit 129: Shell plc - Segment focus
- 10.12 TotalEnergies SE
- Exhibit 130: TotalEnergies SE - Overview
- Exhibit 131: TotalEnergies SE - Business segments
- Exhibit 132: TotalEnergies SE - Key news
- Exhibit 133: TotalEnergies SE - Key offerings
- Exhibit 134: TotalEnergies SE - Segment focus
11 Appendix
- 11.2 Inclusions and exclusions checklist
- Exhibit 135: Inclusions checklist
- Exhibit 136: Exclusions checklist
- 11.3 Currency conversion rates for US$
- Exhibit 137: Currency conversion rates for US$
- 11.4 Research methodology
- Exhibit 138: Research methodology
- Exhibit 139: Validation techniques employed for market sizing
- Exhibit 140: Information sources
- 11.5 List of abbreviations
- Exhibit 141: List of abbreviations
About Technavio
Technavio is a leading global technology research and advisory company. Their research and analysis focuses on emerging market trends and provides actionable insights to help businesses identify market opportunities and develop effective strategies to optimize their market positions.
With over 500 specialized analysts, Technavio's report library consists of more than 17,000 reports and counting, covering 800 technologies, spanning across 50 countries. Their client base consists of enterprises of all sizes, including more than 100 Fortune 500 companies. This growing client base relies on Technavio's comprehensive coverage, extensive research, and actionable market insights to identify opportunities in existing and potential markets and assess their competitive positions within changing market scenarios.
Contacts
Technavio Research Jesse Maida Media & Marketing Executive US: +1 844 364 1100 UK: +44 203 893 3200 Email: [email protected] Website:
SOURCE Technavio
MENAFN13052022003732001241ID1104211026
Legal Disclaimer:
MENAFN provides the information “as is” without warranty of any kind. We do not accept any responsibility or liability for the accuracy, content, images, videos, licenses, completeness, legality, or reliability of the information contained in this article. If you have any complaints or copyright issues related to this article, kindly contact the provider above.