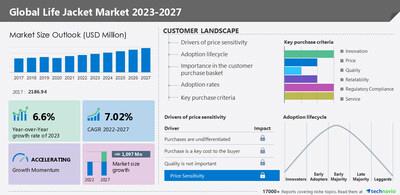
(MENAFN- PR Newswire) NEW YORK, Jan. 23, 2023 /PRNewswire/ -- According to Technavio, the global life jacket market size is estimated to grow by USD 1,097 million from 2022 to 2027. The market is estimated to grow at a CAGR of 7.02% during the forecast period. APAC held the largest share of the global market in 2022, and the market in the region is estimated to witness an incremental growth of 32%.
For more Insights on market size,
request a sample report
Life jacket market - Five Forces
The global cloud data warehouse market is fragmented, and the five forces analysis covers–
continue reading
Technavio has announced its latest market research report titled Global Life Jacket Market 2023-2027
Bargaining Power of Buyers
The threat of New Entrants Threat of Rivalry Bargaining Power of Suppliers Threat of Substitutes Interpretation of porter's five models helps to strategize the business, for entire details – buy the report!
Life jacket market – Customer Landscape
The report includes the market's adoption lifecycle, from the innovator's stage to the laggard's stage. It focuses on adoption rates in different regions based on penetration. Furthermore, the report also includes key purchase criteria and drivers of price sensitivity to help companies evaluate and develop their growth strategies.
Life jacket market - Segmentation Assessment
Segment Overview
Technavio has segmented the market based on end-user (commercial operators, professional users, and swift water rescue users), product (inherent and inflatable), and geography (North America, Europe, APAC, South America, and Middle East and Africa).
The market growth in the commercial operators segment will be significant during the forecast period. The growth in purchasing power has increased the number of international travelers worldwide. The rise in the number of international travelers has encouraged commercial operators to offer attractive packages and professional guidance for adventure water sports activities. These factors are driving the growth of the segment.
Geography Overview
By geography, the global life jacket market is segmented into North America, Europe, APAC, South America, and Middle East and Africa. The report provides actionable insights and estimates the contribution of all regions to the growth of the global life jacket market.
APAC will account for 32% of the market growth during the forecast period. APAC is the fastest-growing market for life jackets among all the geographic regions. The region has over 25,000 islands that attract many international water sports enthusiasts every year. In addition, increasing participation by women in watersports is fostering the growth of the regional market.
download a sample report
Life jacket market – Market Dynamics
Key factor driving market growth
The market is driven by the growing popularity of watersports tourism. Participation in water sports such as water polo, surfing, wakeboarding, jet skiing, kayaking, boating, river rafting, and river boarding is increasing across the globe. Governments and non-government organizations are encouraging people to participate in these adventure activities through various initiatives. Changes in lifestyles and rising expenditure on recreational activities have also increased people's participation in water sports. Furthermore, the increase in the number of women enthusiasts in recreational activities is fostering the growth of the global life jacket market.
Leading trends influencing the market
The expansion of water sports infrastructure for a better experience is the key trend in the market. Many countries have water sporting activities in small fragmented units that lack necessary funding. Hence, many initiatives are being undertaken to encourage the growth and expansion of water sporting facilities across the globe. For instance, Europe has been introducing initiatives aimed at strengthening the water sports industry through the Facilities for the Water Sports Industry (FAWI) project. The project focuses on professionalizing and economically strengthening the water sports industry through sustainable development practices, regular upgrades, and cross-border collaborations in the water sports segment. Similarly, Andhra Pradesh, a state in
India, introduced novel water sports activities such as seaplanes and amphibious vehicles, jeep parasailing, and para-motoring. With the growing number of initiatives to expand the watersports industry, the demand for life jackets will increase during the forecast period.
Major challenges hindering the market growth
The frequent need for maintenance of life jackets is identified as the key challenge in the market. Life jackets need to be regularly inspected to avoid fatal accidents that could happen due to leaks, fabric degradation, or inadequately installed CO2 cylinders. These jackets wear out and lose efficiency with constant use. Besides, vendors are under constant pressure from government bodies and customers to design life jackets that require less maintenance, which is hindering the growth of the market.
driver, trend, and challenges are the factors of market dynamics that state about consequences & sustainability of the businesses, find some insights from a sample report!
What are the key data covered in this life jacket market report?
CAGR of the market during the forecast period Detailed information on factors that will drive the growth of the life jacket market between 2023 and 2027 Precise estimation of the size of the life jacket market size and its contribution to the market in focus on the parent market Accurate predictions about upcoming trends and changes in consumer behavior Growth of the life jacket market industry across North America, Europe, APAC, South America, and Middle East and Africa A thorough analysis of the market's competitive landscape and detailed information about vendors Comprehensive analysis of factors that will challenge the growth of life jacket market vendors
Gain instant access to 17,000+ market research reports.
technavio's subscription platform
Related Reports:
The personal flotation devices market size is expected to increase to USD 1.85 billion from 2021 to 2026, and the market's growth momentum will accelerate at a CAGR of 4.78%. The increasing focus on preventing marine fatalities is notably driving the personal flotation devices (PFD) market growth, although factors such as the selection of the right PFDs may impede market growth. The reflective sportswear market is estimated to grow at a CAGR of 4.3% between 2022 and 2027. The size of the market is forecast to increase by USD 333.51 million. The improved marketing strategies by key competitors are notably driving the market growth, although factors such as the greater availability of counterfeit products may impede the market growth.
| Life Jacket Market Scope |
| Report Coverage | Details |
| Page number | 155 |
| Base year | 2022 |
| Historic period | 2017-2021 |
| Forecast period | 2023-2027 |
| Growth momentum & CAGR | Accelerate at a CAGR of 7.02% |
| Market growth 2023-2027 | USD 1,097 million |
| Market structure | Fragmented |
| YoY growth 2022-2023
(%) | 6.6 |
| Regional analysis | North America, Europe, APAC, South America, and Middle East and Africa |
| Performing market contribution | APAC at 32% |
| Key countries | US, China, Australia, UK, and Brazil |
| Competitive landscape | Leading Vendors, Market Positioning of Vendors, Competitive Strategies, and Industry Risks |
| Key companies profiled | Absolute Outdoor Inc., Aqua Leisure Recreation LLC, Aqua Life, Dongguan City Bestway Sports Goods Co. Ltd., Ganesh Manufacturing, Grand Ocean Marine Co. Ltd., H3O Water Sports, Jiangsu Baizhou Safety Technology Co. Ltd., Johnson Outdoors Inc., Kibo Software Inc., Majestic Marine and Engineering Services, Newell Brands Inc., SeaSafe Systems Ltd., Spinlock Ltd., Stormy Lifejackets Pty Ltd., Survitec Group Ltd., VIKING LIFE SAVING EQUIPMENT AS, Wing Group, Air Liquide SA, and Alliance Marine |
| Market dynamics | Parent market analysis, market growth inducers and obstacles, fast-growing and slow-growing segment analysis, COVID-19 impact and recovery analysis and future consumer dynamics, and market condition analysis for the forecast period. |
| Customization purview | If our report has not included the data that you are looking for, you can reach out to our analysts and get segments customized. |
Table of contents:
1 Executive Summary
1.1 Market overview
Exhibit 01: Executive Summary – Chart on Market Overview Exhibit 02: Executive Summary – Data Table on Market Overview Exhibit 03: Executive Summary – Chart on Global Market Characteristics Exhibit 04: Executive Summary – Chart on Market by Geography Exhibit 05: Executive Summary – Chart on Market Segmentation by End-user Exhibit 06: Executive Summary – Chart on Market Segmentation by Product Exhibit 07: Executive Summary – Chart on Incremental Growth Exhibit 08: Executive Summary – Data Table on Incremental Growth Exhibit 09: Executive Summary – Chart on Vendor Market Positioning
2 Market Landscape
2.1 Market ecosystem
Exhibit 10: Parent market Exhibit 11: Market Characteristics
3 Market Sizing
3.1 Market definition
Exhibit 12: Offerings of vendors included in the market definition
3.2 Market segment analysis
Exhibit 13: Market segments
3.4 Market outlook: Forecast for 2022-2027
Exhibit 14: Chart on Global - Market size and forecast 2022-2027 ($ million) Exhibit 15: Data Table on Global - Market size and forecast 2022-2027 ($ million) Exhibit 16: Chart on Global Market: Year-over-year growth 2022-2027 (%) Exhibit 17: Data Table on Global Market: Year-over-year growth 2022-2027 (%)
4 Historic Market Size
4.1 Global life jacket market 2017 - 2021
Exhibit 18: Historic Market Size – Data Table on Global life jacket market 2017 - 2021 ($ million)
4.2 End-user Segment Analysis 2017 - 2021
Exhibit 19: Historic Market Size – End-user Segment 2017 - 2021 ($ million)
4.3 Product Segment Analysis 2017 - 2021
Exhibit 20: Historic Market Size – Product Segment 2017 - 2021 ($ million)
4.4 Geography Segment Analysis 2017 - 2021
Exhibit 21: Historic Market Size – Geography Segment 2017 - 2021 ($ million)
4.5 Country Segment Analysis 2017 - 2021
Exhibit 22: Historic Market Size – Country Segment 2017 - 2021 ($ million)
5 Five Forces Analysis
5.1 Five forces summary
Exhibit 23: Five forces analysis - Comparison between 2022 and 2027
5.2 Bargaining power of buyers
Exhibit 24: Chart on Bargaining power of buyers – Impact of key factors 2022 and 2027
5.3 Bargaining power of suppliers
Exhibit 25: Bargaining power of suppliers – Impact of key factors in 2022 and 2027
5.4 Threat of new entrants
Exhibit 26: Threat of new entrants – Impact of key factors in 2022 and 2027
5.5 Threat of substitutes
Exhibit 27: Threat of substitutes – Impact of key factors in 2022 and 2027
5.6 Threat of rivalry
Exhibit 28: Threat of rivalry – Impact of key factors in 2022 and 2027
5.7 Market condition
Exhibit 29: Chart on Market condition - Five forces 2022 and 2027
6 Market Segmentation by End-user
6.1 Market segments
Exhibit 30: Chart on End-user - Market share 2022-2027 (%) Exhibit 31: Data Table on End-user - Market share 2022-2027 (%)
6.2 Comparison by End-user
Exhibit 32: Chart on Comparison by End-user Exhibit 33: Data Table on Comparison by End-user
6.3 Commercial operators - Market size and forecast 2022-2027 Exhibit 34: Chart on Commercial operators - Market size and forecast 2022-2027 ($ million) Exhibit 35: Data Table on Commercial operators - Market size and forecast 2022-2027 ($ million) Exhibit 36: Chart on Commercial operators - Year-over-year growth 2022-2027 (%) Exhibit 37: Data Table on Commercial operators - Year-over-year growth 2022-2027 (%)
6.4 Professional users - Market size and forecast 2022-2027 Exhibit 38: Chart on Professional users - Market size and forecast 2022-2027 ($ million) Exhibit 39: Data Table on Professional users - Market size and forecast 2022-2027 ($ million) Exhibit 40: Chart on Professional users - Year-over-year growth 2022-2027 (%) Exhibit 41: Data Table on Professional users - Year-over-year growth 2022-2027 (%)
6.5 Swift water rescue users - Market size and forecast 2022-2027
Exhibit 42: Chart on Swift water rescue users - Market size and forecast 2022-2027 ($ million) Exhibit 43: Data Table on Swift water rescue users - Market size and forecast 2022-2027 ($ million) Exhibit 44: Chart on Swift water rescue users - Year-over-year growth 2022-2027 (%) Exhibit 45: Data Table on Swift water rescue users - Year-over-year growth 2022-2027 (%)
6.6 Market opportunity by End-user
Exhibit 46: Market opportunity by End-user ($ million)
7 Market Segmentation by Product
7.1 Market segments
Exhibit 47: Chart on Product - Market share 2022-2027 (%) Exhibit 48: Data Table on Product - Market share 2022-2027 (%)
7.2 Comparison by Product
Exhibit 49: Chart on Comparison by Product Exhibit 50: Data Table on Comparison by Product
7.3 Inherent - Market size and forecast 2022-2027 Exhibit 51: Chart on Inherent - Market size and forecast 2022-2027 ($ million) Exhibit 52: Data Table on Inherent - Market size and forecast 2022-2027 ($ million) Exhibit 53: Chart on Inherent - Year-over-year growth 2022-2027 (%) Exhibit 54: Data Table on Inherent - Year-over-year growth 2022-2027 (%)
7.4 Inflatable - Market size and forecast 2022-2027 Exhibit 55: Chart on Inflatable - Market size and forecast 2022-2027 ($ million) Exhibit 56: Data Table on Inflatable - Market size and forecast 2022-2027 ($ million) Exhibit 57: Chart on Inflatable - Year-over-year growth 2022-2027 (%) Exhibit 58: Data Table on Inflatable - Year-over-year growth 2022-2027 (%)
7.5 Market opportunity by Product
Exhibit 59: Market opportunity by Product ($ million)
8 Customer Landscape
8.1 Customer landscape overview
Exhibit 60: Analysis of price sensitivity, lifecycle, customer purchase basket, adoption rates, and purchase criteria
9 Geographic Landscape
9.1 Geographic segmentation
Exhibit 61: Chart on Market share by geography 2022-2027 (%) Exhibit 62: Data Table on Market share by geography 2022-2027 (%)
9.2 Geographic comparison
Exhibit 63: Chart on Geographic comparison Exhibit 64: Data Table on Geographic comparison
9.3 North America - Market size and forecast 2022-2027 Exhibit 65: Chart on North America - Market size and forecast 2022-2027 ($ million) Exhibit 66: Data Table on North America - Market size and forecast 2022-2027 ($ million) Exhibit 67: Chart on North America - Year-over-year growth 2022-2027 (%) Exhibit 68: Data Table on North America - Year-over-year growth 2022-2027 (%)
9.4 Europe - Market size and forecast 2022-2027 Exhibit 69: Chart on Europe - Market size and forecast 2022-2027 ($ million) Exhibit 70: Data Table on Europe - Market size and forecast 2022-2027 ($ million) Exhibit 71: Chart on Europe - Year-over-year growth 2022-2027 (%) Exhibit 72: Data Table on Europe - Year-over-year growth 2022-2027 (%)
9.5 APAC - Market size and forecast 2022-2027 Exhibit 73: Chart on APAC - Market size and forecast 2022-2027 ($ million) Exhibit 74: Data Table on APAC - Market size and forecast 2022-2027 ($ million) Exhibit 75: Chart on APAC - Year-over-year growth 2022-2027 (%) Exhibit 76: Data Table on APAC - Year-over-year growth 2022-2027 (%)
9.6 South America - Market size and forecast 2022-2027 Exhibit 77: Chart on South America - Market size and forecast 2022-2027 ($ million) Exhibit 78: Data Table on South America - Market size and forecast 2022-2027 ($ million) Exhibit 79: Chart on South America - Year-over-year growth 2022-2027 (%) Exhibit 80: Data Table on South America - Year-over-year growth 2022-2027 (%)
9.7 Middle East and Africa - Market size and forecast 2022-2027
Exhibit 81: Chart on Middle East and Africa - Market size and forecast 2022-2027 ($ million) Exhibit 82: Data Table on Middle East and Africa - Market size and forecast 2022-2027 ($ million) Exhibit 83: Chart on Middle East and Africa - Year-over-year growth 2022-2027 (%) Exhibit 84: Data Table on Middle East and Africa - Year-over-year growth 2022-2027 (%)
9.8 US - Market size and forecast 2022-2027 Exhibit 85: Chart on US - Market size and forecast 2022-2027 ($ million) Exhibit 86: Data Table on US - Market size and forecast 2022-2027 ($ million) Exhibit 87: Chart on US - Year-over-year growth 2022-2027 (%) Exhibit 88: Data Table on US - Year-over-year growth 2022-2027 (%)
9.9 UK - Market size and forecast 2022-2027 Exhibit 89: Chart on UK - Market size and forecast 2022-2027 ($ million) Exhibit 90: Data Table on UK - Market size and forecast 2022-2027 ($ million) Exhibit 91: Chart on UK - Year-over-year growth 2022-2027 (%) Exhibit 92: Data Table on UK - Year-over-year growth 2022-2027 (%)
9.10 China - Market size and forecast 2022-2027 Exhibit 93: Chart on China - Market size and forecast 2022-2027 ($ million) Exhibit 94: Data Table on China - Market size and forecast 2022-2027 ($ million) Exhibit 95: Chart on China - Year-over-year growth 2022-2027 (%) Exhibit 96: Data Table on China - Year-over-year growth 2022-2027 (%)
9.11 Brazil - Market size and forecast 2022-2027 Exhibit 97: Chart on Brazil - Market size and forecast 2022-2027 ($ million) Exhibit 98: Data Table on Brazil - Market size and forecast 2022-2027 ($ million) Exhibit 99: Chart on Brazil - Year-over-year growth 2022-2027 (%) Exhibit 100: Data Table on Brazil - Year-over-year growth 2022-2027 (%)
9.12 Australia - Market size and forecast 2022-2027 Exhibit 101: Chart on Australia - Market size and forecast 2022-2027 ($ million) Exhibit 102: Data Table on Australia - Market size and forecast 2022-2027 ($ million) Exhibit 103: Chart on Australia - Year-over-year growth 2022-2027 (%) Exhibit 104: Data Table on Australia - Year-over-year growth 2022-2027 (%)
9.13 Market opportunity by geography
Exhibit 105: Market opportunity by geography ($ million)
10 Drivers, Challenges, and Trends
10.3 Impact of drivers and challenges
Exhibit 106: Impact of drivers and challenges in 2022 and 2027
11 Vendor Landscape
11.2 Vendor landscape
Exhibit 107: Overview on Criticality of inputs and Factors of differentiation
11.3 Landscape disruption
Exhibit 108: Overview on factors of disruption
11.4 Industry risks
Exhibit 109: Impact of key risks on business
12 Vendor Analysis
12.1 Vendors covered
Exhibit 110: Vendors covered
12.2 Market positioning of vendors
Exhibit 111: Matrix on vendor position and classification
12.3 Absolute Outdoor Inc.
Exhibit 112: Absolute Outdoor Inc. - Overview Exhibit 113: Absolute Outdoor Inc. - Product / Service Exhibit 114: Absolute Outdoor Inc. - Key offerings
12.4 Alliance Marine
Exhibit 115: Alliance Marine - Overview Exhibit 116: Alliance Marine - Product / Service Exhibit 117: Alliance Marine - Key offerings
12.5 Aqua Leisure Recreation LLC
Exhibit 118: Aqua Leisure Recreation LLC - Overview Exhibit 119: Aqua Leisure Recreation LLC - Product / Service Exhibit 120: Aqua Leisure Recreation LLC - Key offerings
12.6 Dongguan City Bestway Sports Goods Co. Ltd. Exhibit 121: Dongguan City Bestway Sports Goods Co. Ltd. - Overview Exhibit 122: Dongguan City Bestway Sports Goods Co. Ltd. - Product / Service Exhibit 123: Dongguan City Bestway Sports Goods Co. Ltd. - Key offerings
12.7 Ganesh Manufacturing
Exhibit 124: Ganesh Manufacturing - Overview Exhibit 125: Ganesh Manufacturing - Product / Service Exhibit 126: Ganesh Manufacturing - Key offerings
12.8 Grand Ocean Marine Co. Ltd.
Exhibit 127: Grand Ocean Marine Co. Ltd. - Overview Exhibit 128: Grand Ocean Marine Co. Ltd. - Product / Service Exhibit 129: Grand Ocean Marine Co. Ltd. - Key offerings
12.9 Jiangsu Baizhou Safety Technology Co. Ltd. Exhibit 130: Jiangsu Baizhou Safety Technology Co. Ltd. - Overview Exhibit 131: Jiangsu Baizhou Safety Technology Co. Ltd. - Product / Service Exhibit 132: Jiangsu Baizhou Safety Technology Co. Ltd. - Key offerings
12.10 Johnson Outdoors Inc.
Exhibit 133: Johnson Outdoors Inc. - Overview Exhibit 134: Johnson Outdoors Inc. - Business segments Exhibit 135: Johnson Outdoors Inc. - Key offerings Exhibit 136: Johnson Outdoors Inc. - Segment focus
12.11 Kibo Software Inc.
Exhibit 137: Kibo Software Inc. - Overview Exhibit 138: Kibo Software Inc. - Product / Service Exhibit 139: Kibo Software Inc. - Key offerings
12.12 Majestic Marine and Engineering Services Exhibit 140: Majestic Marine and Engineering Services - Overview Exhibit 141: Majestic Marine and Engineering Services - Product / Service Exhibit 142: Majestic Marine and Engineering Services - Key offerings
12.13 Newell Brands Inc.
Exhibit 143: Newell Brands Inc. - Overview Exhibit 144: Newell Brands Inc. - Business segments Exhibit 145: Newell Brands Inc. - Key news Exhibit 146: Newell Brands Inc. - Key offerings Exhibit 147: Newell Brands Inc. - Segment focus
12.14 Stormy Lifejackets Pty Ltd.
Exhibit 148: Stormy Lifejackets Pty Ltd. - Overview Exhibit 149: Stormy Lifejackets Pty Ltd. - Product / Service Exhibit 150: Stormy Lifejackets Pty Ltd. - Key offerings
12.15 Survitec Group Ltd.
Exhibit 151: Survitec Group Ltd. - Overview Exhibit 152: Survitec Group Ltd. - Product / Service Exhibit 153: Survitec Group Ltd. - Key offerings
12.16 VIKING LIFE SAVING EQUIPMENT AS
Exhibit 154: VIKING LIFE SAVING EQUIPMENT AS - Overview Exhibit 155: VIKING LIFE SAVING EQUIPMENT AS - Product / Service Exhibit 156: VIKING LIFE SAVING EQUIPMENT AS - Key offerings
12.17 Wing Group
Exhibit 157: Wing Group - Overview Exhibit 158: Wing Group - Product / Service Exhibit 159: Wing Group - Key offerings
13 Appendix
13.2 Inclusions and exclusions checklist
Exhibit 160: Inclusions checklist Exhibit 161: Exclusions checklist
13.3 Currency conversion rates for US$
Exhibit 162: Currency conversion rates for US$
13.4 Research methodology
Exhibit 163: Research methodology Exhibit 164: Validation techniques employed for market sizing Exhibit 165: Information sources
13.5 List of abbreviations
Exhibit 166: List of abbreviations
About Us
Technavio is a leading global technology research and advisory company. Their research and analysis focuses on emerging market trends and provides actionable insights to help businesses identify market opportunities and develop effective strategies to optimize their market positions. With over 500 specialized analysts, Technavio's report library consists of more than 17,000 reports and counting, covering 800 technologies, spanning across 50 countries. Their client base consists of enterprises of all sizes, including more than 100 Fortune 500 companies. This growing client base relies on Technavio's comprehensive coverage, extensive research, and actionable market insights to identify opportunities in existing and potential markets and assess their competitive positions within changing market scenarios.
Contact
Technavio Research
Jesse Maida
Media & Marketing Executive
US: +1 844 364 1100
UK: +44 203 893 3200
Email: [email protected]
Website:
SOURCE Technavio