(MENAFN- PR Newswire) NEW YORK, Nov. 2, 2022 /PRNewswire/ -- The
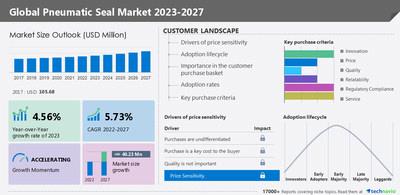
share is set to increase by USD 40.23 million from 2022 to 2027. Moreover, the market's growth momentum will accelerate at a CAGR of 5.73%
as per the latest market forecast report by Technavio. The market will also record a 4.56% Y-O-Y growth rate during the forecast period.
To know more about the historic market size–
Technavio has announced its latest market research report titled Global Pneumatic Seal Market 2023-2027
Global Pneumatic Seal Market -
Parent Market Analysis
Technavio categorizes the global pneumatic seal market as a part of the global industrial machinery market . The parent market, the global industrial machinery market, covers companies engaged in manufacturing industrial machinery and components covering presses, machine tools, compressors, pollution control equipment, elevators, escalators, insulators, pumps, roller bearings, and other metal fabrications. Technavio calculates the market size based on combined revenue generated by manufacturers of machinery and components used in the industrial environment.
For more information parent market along with value chain analysis –
Global Pneumatic Seal Market
Characteristics with Five Forces–
The Global Pneumatic Seal Market
is fragmented and the five forces analysis by Technavio gives an accurate vision –
Bargaining Power of Buyers The threat of New Entrants Threat of Rivalry Bargaining Power of Suppliers For information on the impact of the five forces analysis–
Global Pneumatic Seal Market – Customer Landscape
The disruption threats are strategic in nature, and operational risks for suppliers have been mapped based on their negative business impact and probability of occurrence.
The potential for the customer landscape will be available with Technavio Reports –
Global Pneumatic Seal Market -
Segmentation Assessment
Geography Segment Overview
Technavio's market research report entails detailed information on regional opportunities in store for vendors, which will assist in generating sales revenues. The
Global Pneumatic Seal Market
as per geography is categorized into North America, Europe, APAC, South America, and the Middle East and Africa. The report provides an accurate prediction of the contribution of all regions to the growth of the Global Pneumatic Seal Market
size and actionable market understandings.
Regional Highlights:
APAC
is the fastest-growing region in the global pneumatic seal market compared to other regions. 46% growth will originate from APAC. The Government of China is focusing on
encouraging foreign investments by oil and gas companies by removing the necessity to form a joint venture to set up production facilities in the country. Such actions are expected to increase investments in oil production in China, which will drive the demand for pneumatic seals.
Product Type Segment Overview
The Global Pneumatic Seal Market as per product type segmentation is categorized into Cylinders and Valves. Revenue Generating Segment - The cylinders segment will be a significant contributor to market growth during the forecast period. Pneumatic cylinders have low initial investment cost and durability. The demand for small and powerful and effective equipment has led to the development of a wide range of cylinders.
Download a FREE Sample Report that can help you to strategize your sales revenue -
Global Pneumatic Seal Market
– Market Dynamics
Major Driver Boosting the Market
The increase in the application of pneumatics in food processing is driving the global pneumatic seal market growth. The use of pneumatic equipment in the food processing industry has been supported by the US Food and Drug Administration's rules. Key suppliers are expanding their product offerings to enable equipment manufacturers to provide corrosion-resistant construction materials such as stainless steel. Therefore, the rise in pneumatic applications in the food processing industry will fuel the growth of the market during the forecast period.
Major trends influencing the growth of glamping
High-performance pneumatics are a trend in the market. Servo-pneumatic equipment provides precise and smoother operations than conventional pneumatics. These benefits are possible with the use of special motion control capabilities that are designed specifically for pneumatic motion regulation and integration with other high-performance components. These advances will drive the growth of the global pneumatic seal market during the forecast period.
Major Challenges interrupting the market growth
The growing demand for electromechanical equipment is challenging the global pneumatic seal market growth. Electromechanical equipment is gaining prominence over pneumatic equipment due to increasing concerns about environmental issues and the high energy consumption of pneumatic equipment. Moreover, the rising number of environmental regulations imposed by governments will result in the replacement of pneumatic equipment with electromechanical equipment. Such factors are expected to impede the growth of the global pneumatic seal market during the forecast period.
To know about other factors of market dynamics –
Technavio suggests three forecast scenarios (optimistic, probable, and pessimistic) considering the impact of COVID-19. Technavio's in-depth research has direct and indirect COVID-19-impacted market research reports.
Register for a free trial today and gain instant access to 17,000+ market research reports.
Cloud Pneumatic Seal Market 2023-2027: Key Highlights
CAGR of the market during the forecast period 2023-2027 Detailed information on factors that will assist pneumatic seal market
growth during the next five years Estimation of the pneumatic seal market
size and its contribution to the parent market Predictions on upcoming trends and changes in consumer behavior The growth of the pneumatic seal market Analysis of the market's competitive landscape and detailed information on vendors Comprehensive details of factors that will challenge the growth of pneumatic seal market vendors
Related Reports:
The share growth of USD 1305.25 million from 2022 to 2027 for the hydraulic seals market, and it is estimated to grow at a CAGR of 5.51%. The market has been segmented by product type (rod seals, piston seals, wiper seals, and others), end-user (automotive and aerospace, heavy industry, and others), region (North America, Europe, APAC, Middle East and Africa, and South America). The share is expected to increase to USD 380.16 million from 2021 to 2026, and the market's growth momentum will accelerate at a CAGR of 3.01%. This report extensively covers segmentation by product (ring type seals, static seals, thread seals, and specialty products), end-user (process industries and discrete industries), and geography (APAC, North America, Europe, South America, and Middle East and Africa).
| Pneumatic Seal Market Scope |
| Report Coverage | Details |
| Page number | 120 |
| Base year | 2022 |
| Historical year | 2017-2021 |
| Forecast period | 2023-2027 |
| Growth momentum & CAGR | Accelerate at a CAGR of 5.73% |
| Market growth 2023-2027 | USD 40.23 million |
| Market structure | Fragmented |
| YoY growth (%) | 4.56 |
| Regional analysis | APAC, Europe, North America, South America, and the Middle East and Africa |
| Performing market contribution | APAC at 46% |
| Key consumer countries | US, China, India, Russia, and UK |
| Competitive landscape | Leading companies, competitive strategies, consumer engagement scope |
| Key companies profiled | A.W. Chesterton Co., AB SKF, AccroSeal, All Seals Inc., Allied Metrics Seals & Fasteners Inc., AS Aston Seals S.P.A., France Joint SAS, Freudenberg SE, Ge Mao Rubber Industrial Co. Ltd., GMN Paul Muller Industrie GmbH & Co. KG, Hallite Seals International Ltd., IDEX Corp., Kastas Sealing Technology, M.Barnwell Services Ltd., Max Spare Ltd., OZ Seals Pty Ltd., Parker Hannifin Corp., T LON Products Inc., Trelleborg AB, and EnPro Industries Inc. |
| Market dynamics | Parent market analysis, market growth inducers and obstacles, fast-growing and slow-growing segment analysis, COVID-19 impact and recovery analysis and future consumer dynamics, and market condition analysis for the forecast period. |
| Customization purview | If our report has not included the data that you are looking for, you can reach out to our analysts and get segments customized. |
Browse
Market Reports
Table of Contents
1 Executive Summary
1.1 Market overview
Exhibit 01: Executive Summary – Chart on Market Overview Exhibit 02: Executive Summary – Data Table on Market Overview Exhibit 03: Executive Summary – Chart on Global Market Characteristics Exhibit 04: Executive Summary – Chart on Market by Geography Exhibit 05: Executive Summary – Chart on Market Segmentation by Product Type Exhibit 06: Executive Summary – Chart on Market Segmentation by Application Exhibit 07: Executive Summary – Chart on Incremental Growth Exhibit 08: Executive Summary – Data Table on Incremental Growth Exhibit 09: Executive Summary – Chart on Vendor Market Positioning
2 Market Landscape
2.1 Market ecosystem
Exhibit 10: Parent market Exhibit 11: Market Characteristics
3 Market Sizing
3.1 Market definition
Exhibit 12: Offerings of vendors included in the market definition
3.2 Market segment analysis
Exhibit 13: Market segments
3.4 Market outlook: Forecast for 2022-2027
Exhibit 14: Chart on Global - Market size and forecast 2022-2027 ($ million) Exhibit 15: Data Table on Global - Market size and forecast 2022-2027 ($ million) Exhibit 16: Chart on Global Market: Year-over-year growth 2022-2027 (%) Exhibit 17: Data Table on Global Market: Year-over-year growth 2022-2027 (%)
4 Five Forces Analysis
4.1 Five forces summary
Exhibit 18: Five forces analysis - Comparison between 2022 and 2027
4.2 Bargaining power of buyers
Exhibit 19: Chart on Bargaining power of buyers – Impact of key factors 2022 and 2027
4.3 Bargaining power of suppliers
Exhibit 20: Bargaining power of suppliers – Impact of key factors in 2022 and 2027
4.4 Threat of new entrants
Exhibit 21: Threat of new entrants – Impact of key factors in 2022 and 2027
4.5 Threat of substitutes
Exhibit 22: Threat of substitutes – Impact of key factors in 2022 and 2027
4.6 Threat of rivalry
Exhibit 23: Threat of rivalry – Impact of key factors in 2022 and 2027
4.7 Market condition
Exhibit 24: Chart on Market condition - Five forces 2022 and 2027
5 Market Segmentation by Product Type
5.1 Market segments
Exhibit 25: Chart on Product Type - Market share 2022-2027 (%) Exhibit 26: Data Table on Product Type - Market share 2022-2027 (%)
5.2 Comparison by Product Type
Exhibit 27: Chart on Comparison by Product Type Exhibit 28: Data Table on Comparison by Product Type
5.3 Cylinders - Market size and forecast 2022-2027 Exhibit 29: Chart on Cylinders - Market size and forecast 2022-2027 ($ million) Exhibit 30: Data Table on Cylinders - Market size and forecast 2022-2027 ($ million) Exhibit 31: Chart on Cylinders - Year-over-year growth 2022-2027 (%) Exhibit 32: Data Table on Cylinders - Year-over-year growth 2022-2027 (%)
5.4 Valve - Market size and forecast 2022-2027 Exhibit 33: Chart on Valve - Market size and forecast 2022-2027 ($ million) Exhibit 34: Data Table on Valve - Market size and forecast 2022-2027 ($ million) Exhibit 35: Chart on Valve - Year-over-year growth 2022-2027 (%) Exhibit 36: Data Table on Valve - Year-over-year growth 2022-2027 (%)
5.5 Market opportunity by Product Type
Exhibit 37: Market opportunity by Product Type ($ million)
6 Market Segmentation by Application
6.1 Market segments
Exhibit 38: Chart on Application - Market share 2022-2027 (%) Exhibit 39: Data Table on Application - Market share 2022-2027 (%)
6.2 Comparison by Application
Exhibit 40: Chart on Comparison by Application Exhibit 41: Data Table on Comparison by Application
6.3 Equipment manufacturing - Market size and forecast 2022-2027
Exhibit 42: Chart on Equipment manufacturing - Market size and forecast 2022-2027 ($ million) Exhibit 43: Data Table on Equipment manufacturing - Market size and forecast 2022-2027 ($ million) Exhibit 44: Chart on Equipment manufacturing - Year-over-year growth 2022-2027 (%) Exhibit 45: Data Table on Equipment manufacturing - Year-over-year growth 2022-2027 (%)
6.4 Automobile - Market size and forecast 2022-2027 Exhibit 46: Chart on Automobile - Market size and forecast 2022-2027 ($ million) Exhibit 47: Data Table on Automobile - Market size and forecast 2022-2027 ($ million) Exhibit 48: Chart on Automobile - Year-over-year growth 2022-2027 (%) Exhibit 49: Data Table on Automobile - Year-over-year growth 2022-2027 (%)
6.5 Shipping Industry - Market size and forecast 2022-2027 Exhibit 50: Chart on Shipping Industry - Market size and forecast 2022-2027 ($ million) Exhibit 51: Data Table on Shipping Industry - Market size and forecast 2022-2027 ($ million) Exhibit 52: Chart on Shipping Industry - Year-over-year growth 2022-2027 (%) Exhibit 53: Data Table on Shipping Industry - Year-over-year growth 2022-2027 (%)
6.6 Others - Market size and forecast 2022-2027 Exhibit 54: Chart on Others - Market size and forecast 2022-2027 ($ million) Exhibit 55: Data Table on Others - Market size and forecast 2022-2027 ($ million) Exhibit 56: Chart on Others - Year-over-year growth 2022-2027 (%) Exhibit 57: Data Table on Others - Year-over-year growth 2022-2027 (%)
6.7 Market opportunity by Application
Exhibit 58: Market opportunity by Application ($ million)
7 Customer Landscape
7.1 Customer landscape overview
Exhibit 59: Analysis of price sensitivity, lifecycle, customer purchase basket, adoption rates, and purchase criteria
8 Geographic Landscape
8.1 Geographic segmentation
Exhibit 60: Chart on Market share by geography 2022-2027 (%) Exhibit 61: Data Table on Market share by geography 2022-2027 (%)
8.2 Geographic comparison
Exhibit 62: Chart on Geographic comparison Exhibit 63: Data Table on Geographic comparison
8.3 APAC - Market size and forecast 2022-2027 Exhibit 64: Chart on APAC - Market size and forecast 2022-2027 ($ million) Exhibit 65: Data Table on APAC - Market size and forecast 2022-2027 ($ million) Exhibit 66: Chart on APAC - Year-over-year growth 2022-2027 (%) Exhibit 67: Data Table on APAC - Year-over-year growth 2022-2027 (%)
8.4 Europe - Market size and forecast 2022-2027 Exhibit 68: Chart on Europe - Market size and forecast 2022-2027 ($ million) Exhibit 69: Data Table on Europe - Market size and forecast 2022-2027 ($ million) Exhibit 70: Chart on Europe - Year-over-year growth 2022-2027 (%) Exhibit 71: Data Table on Europe - Year-over-year growth 2022-2027 (%)
8.5 North America - Market size and forecast 2022-2027 Exhibit 72: Chart on North America - Market size and forecast 2022-2027 ($ million) Exhibit 73: Data Table on North America - Market size and forecast 2022-2027 ($ million) Exhibit 74: Chart on North America - Year-over-year growth 2022-2027 (%) Exhibit 75: Data Table on North America - Year-over-year growth 2022-2027 (%)
8.6 South America - Market size and forecast 2022-2027 Exhibit 76: Chart on South America - Market size and forecast 2022-2027 ($ million) Exhibit 77: Data Table on South America - Market size and forecast 2022-2027 ($ million) Exhibit 78: Chart on South America - Year-over-year growth 2022-2027 (%) Exhibit 79: Data Table on South America - Year-over-year growth 2022-2027 (%)
8.7 Middle East and Africa - Market size and forecast 2022-2027
Exhibit 80: Chart on Middle East and Africa - Market size and forecast 2022-2027 ($ million) Exhibit 81: Data Table on Middle East and Africa - Market size and forecast 2022-2027 ($ million) Exhibit 82: Chart on Middle East and Africa - Year-over-year growth 2022-2027 (%) Exhibit 83: Data Table on Middle East and Africa - Year-over-year growth 2022-2027 (%)
8.8 China - Market size and forecast 2022-2027 Exhibit 84: Chart on China - Market size and forecast 2022-2027 ($ million) Exhibit 85: Data Table on China - Market size and forecast 2022-2027 ($ million) Exhibit 86: Chart on China - Year-over-year growth 2022-2027 (%) Exhibit 87: Data Table on China - Year-over-year growth 2022-2027 (%)
8.9 India - Market size and forecast 2022-2027 Exhibit 88: Chart on India - Market size and forecast 2022-2027 ($ million) Exhibit 89: Data Table on India - Market size and forecast 2022-2027 ($ million) Exhibit 90: Chart on India - Year-over-year growth 2022-2027 (%) Exhibit 91: Data Table on India - Year-over-year growth 2022-2027 (%)
8.10 US - Market size and forecast 2022-2027 Exhibit 92: Chart on US - Market size and forecast 2022-2027 ($ million) Exhibit 93: Data Table on US - Market size and forecast 2022-2027 ($ million) Exhibit 94: Chart on US - Year-over-year growth 2022-2027 (%) Exhibit 95: Data Table on US - Year-over-year growth 2022-2027 (%)
8.11 Russia - Market size and forecast 2022-2027 Exhibit 96: Chart on Russia - Market size and forecast 2022-2027 ($ million) Exhibit 97: Data Table on Russia - Market size and forecast 2022-2027 ($ million) Exhibit 98: Chart on Russia - Year-over-year growth 2022-2027 (%) Exhibit 99: Data Table on Russia - Year-over-year growth 2022-2027 (%)
8.12 UK - Market size and forecast 2022-2027 Exhibit 100: Chart on UK - Market size and forecast 2022-2027 ($ million) Exhibit 101: Data Table on UK - Market size and forecast 2022-2027 ($ million) Exhibit 102: Chart on UK - Year-over-year growth 2022-2027 (%) Exhibit 103: Data Table on UK - Year-over-year growth 2022-2027 (%)
8.13 Market opportunity by geography
Exhibit 104: Market opportunity by geography ($ million)
9 Drivers, Challenges, and Trends
9.3 Impact of drivers and challenges
Exhibit 105: Impact of drivers and challenges in 2022 and 2027
10 Vendor Landscape
10.2 Vendor landscape
Exhibit 106: Overview on Criticality of inputs and Factors of differentiation
10.3 Landscape disruption
Exhibit 107: Overview on factors of disruption
10.4 Industry risks
Exhibit 108: Impact of key risks on business
11 Vendor Analysis
11.1 Vendors covered
Exhibit 109: Vendors covered
11.2 Market positioning of vendors
Exhibit 110: Matrix on vendor position and classification
11.3 A.W. Chesterton Co.
Exhibit 111: A.W. Chesterton Co. - Overview Exhibit 112: A.W. Chesterton Co. - Product / Service Exhibit 113: A.W. Chesterton Co. - Key offerings
11.4 All Seals Inc.
Exhibit 114: All Seals Inc. - Overview Exhibit 115: All Seals Inc. - Product / Service Exhibit 116: All Seals Inc. - Key offerings
11.5 Allied Metrics Seals and Fasteners Inc. Exhibit 117: Allied Metrics Seals and Fasteners Inc. - Overview Exhibit 118: Allied Metrics Seals and Fasteners Inc. - Product / Service Exhibit 119: Allied Metrics Seals and Fasteners Inc. - Key offerings
11.6 AS Aston Seals S.P.A.
Exhibit 120: AS Aston Seals S.P.A. - Overview Exhibit 121: AS Aston Seals S.P.A. - Product / Service Exhibit 122: AS Aston Seals S.P.A. - Key offerings
11.7 EnPro Industries Inc.
Exhibit 123: EnPro Industries Inc. - Overview Exhibit 124: EnPro Industries Inc. - Business segments Exhibit 125: EnPro Industries Inc. - Key offerings Exhibit 126: EnPro Industries Inc. - Segment focus
11.8 France Joint SAS
Exhibit 127: France Joint SAS - Overview Exhibit 128: France Joint SAS - Product / Service Exhibit 129: France Joint SAS - Key offerings
11.9 Freudenberg SE
Exhibit 130: Freudenberg SE - Overview Exhibit 131: Freudenberg SE - Business segments Exhibit 132: Freudenberg SE - Key news Exhibit 133: Freudenberg SE - Key offerings Exhibit 134: Freudenberg SE - Segment focus
11.10 GMN Paul Muller Industrie GmbH and Co. KG Exhibit 135: GMN Paul Muller Industrie GmbH and Co. KG - Overview Exhibit 136: GMN Paul Muller Industrie GmbH and Co. KG - Product / Service Exhibit 137: GMN Paul Muller Industrie GmbH and Co. KG - Key offerings
11.11 Hallite Seals International Ltd.
Exhibit 138: Hallite Seals International Ltd. - Overview Exhibit 139: Hallite Seals International Ltd. - Product / Service Exhibit 140: Hallite Seals International Ltd. - Key offerings
11.12 IDEX Corp.
Exhibit 141: IDEX Corp. - Overview Exhibit 142: IDEX Corp. - Business segments Exhibit 143: IDEX Corp. - Key offerings Exhibit 144: IDEX Corp. - Segment focus
11.13 Kastas Sealing Technology
Exhibit 145: Kastas Sealing Technology - Overview Exhibit 146: Kastas Sealing Technology - Product / Service Exhibit 147: Kastas Sealing Technology - Key offerings
11.14 Max Spare Ltd.
Exhibit 148: Max Spare Ltd. - Overview Exhibit 149: Max Spare Ltd. - Product / Service Exhibit 150: Max Spare Ltd. - Key offerings
11.15 Parker Hannifin Corp.
Exhibit 151: Parker Hannifin Corp. - Overview Exhibit 152: Parker Hannifin Corp. - Business segments Exhibit 153: Parker Hannifin Corp. - Key news Exhibit 154: Parker Hannifin Corp. - Key offerings Exhibit 155: Parker Hannifin Corp. - Segment focus
11.16 T LON Products Inc.
Exhibit 156: T LON Products Inc. - Overview Exhibit 157: T LON Products Inc. - Product / Service Exhibit 158: T LON Products Inc. - Key offerings
11.17 Trelleborg AB
Exhibit 159: Trelleborg AB - Overview Exhibit 160: Trelleborg AB - Business segments Exhibit 161: Trelleborg AB - Key news Exhibit 162: Trelleborg AB - Key offerings Exhibit 163: Trelleborg AB - Segment focus
12 Appendix
12.2 Inclusions and exclusions checklist
Exhibit 164: Inclusions checklist Exhibit 165: Exclusions checklist
12.3 Currency conversion rates for US$
Exhibit 166: Currency conversion rates for US$
12.4 Research methodology
Exhibit 167: Research methodology Exhibit 168: Validation techniques employed for market sizing Exhibit 169: Information sources
12.5 List of abbreviations
Exhibit 170: List of abbreviations
About Us Technavio is a leading global technology research and advisory company. Their research and analysis focus on emerging market trends and provide actionable insights to help businesses identify market opportunities and develop effective strategies to optimize their market positions. With over 500 specialized analysts, Technavio's report library consists of more than 17,000 reports and counting, covering 800 technologies, spanning 50 countries. Their client base consists of enterprises of all sizes, including more than 100 Fortune 500 companies. This growing client base relies on Technavio's comprehensive coverage, extensive research, and actionable market insights to identify opportunities in existing and potential markets and assess their competitive positions within changing market scenarios.
Contact Technavio ResearchJesse MaidaMedia & Marketing ExecutiveUS: +1 844 364 1100UK: +44 203 893 3200Email: Website:
SOURCE Technavio