(MENAFN- ING) European natural gas injections slow in April
European natural gas prices saw a fair amount of volatility in April. TTF front-month futures traded from a little over EUR25/MWh at the start of April to almost EUR34/MWh mid-month, only to fall back below EUR30/MWh by the end of the month. However, prices yet again rallied in early May. Reduced Norwegian gas flows to Europe, and a late cold spell across large parts of the continent increased heating demand over the second half of April.
Gas storage had been flat in Europe for several weeks at 62% full (although that's increased to 64% more recently). As a result, storage has gone from seasonal record highs at the start of April to being more aligned with levels seen in 2020 at the end of April. While the pace of inventory builds has been below normal for the second half of April, we think Europe will hit 100% full storage ahead of the start of the next heating season. This should keep downward pressure on prices, and we still expect TTF to average EUR25/MWh for the remainder of the injection season.
EU gas injections into storage slow in April (% full)

GIE, ING Research Full storage expected ahead of 2024/25 winter
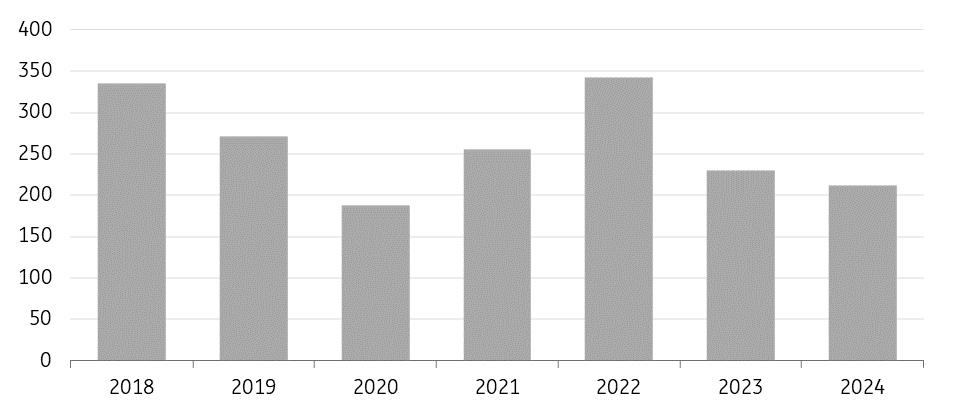
At the end of April, European storage stood at 62% full. This is above the 5-year average of 47% and the 60% full seen at the same stage last year. Europe only needs net injections averaging a little more than 210mcm/day between 1 May and 31 October to see storage 100% full by 1 November. This should be achievable for the region when you consider that since 2018, the only time there has been a lower average net injection was in 2020, largely driven by Covid. Also, dynamics have changed in the European market following the Russia/Ukraine war. However, even if we assume net injections are similar to those in 2020, European storage will reach a little more than 95% full by 1 November, which is still above the European Commission's target of having storage 90% full by this date.
That said, the strength of injections over the summer will depend partly on how strong a demand recovery occurs in the months ahead. Not only has weaker industrial demand weighed on gas consumption, but demand from the power sector has also been weaker due to stronger renewables output. Our balance assumes a 5% YoY increase in EU natural gas demand in 2024, and this increase still sees the region hitting full storage ahead of next winter.
Daily average net injection between May and October (mcm/day)
GIE, ING Research
Note: Chart shows the average daily net injection in the EU between 1 May and 31 October for 2018 to 2023. 2024 data point shows the average daily net injection needed to hit 100% storge by 31 October. European gas flows hold steady
In aggregate, natural gas flows into the EU were largely unchanged in April compared to the previous month at around 24bcm. However, while overall import volumes were unchanged, there were shifts in specific flows. LNG send-outs, Norwegian pipeline flows, Russian pipeline volumes, and Azerbaijani flows all fell over the month. Stronger flows from the UK and North Africa offset these lower volumes.
Lower LNG volumes should not be a surprise. Asia is a more attractive market for spot cargoes due to Asian prices trading at a premium to the European market for much of the year. Asian demand has been strong so far this year, with lower prices attracting price-sensitive buyers back into the market.
Norwegian flows have been lower due to several outages in Norway, which have continued into early May.
As for the UK, the EU was a small net gas exporter to the UK in March, however, this reversed in April with TTF moving from a discount to NBP to a premium. Limited storage in the UK suggests that the EU will remain a net importer of gas from the UK over much of the injection season.
Monthly change in EU gas imports
April vs. March (bcm)

ENTSOG, GIE, ING Research Russian supply risk
Russian pipeline flows via Ukraine and TurkStream increased significantly over the 23/24 heating season. Total inflows between October 2023 and March 2024 were almost 14.5bcm, up from 10bcm for the same period in the previous winter.
However, there is a risk to the bulk of Russian pipeline flows to Europe. Gazprom's transit deal with Ukraine expires at the end of this year, and Ukraine has made it clear that it has no intention of extending the deal. This puts around 15bcm of annual supply at risk, roughly 5% of total EU imports.
There is the potential for Russia to marginally increase flows via TurkStream. However, Europe would still need to replace the bulk of this supply with alternatives. Given the ramp-up of LNG supply over the latter part of this year and through 2025, we believe that Europe will manage if this Russian supply is lost. However, prices will likely still move higher due to a stoppage.
The market will also be increasingly wary about the potential for Russian LNG to be included in European sanctions somewhere down the road.
US natural gas market finds a floor
The US natural gas market appears to have found a floor. Front-month Henry Hub futures traded to a low of US$1.48/MMBtu in March, the lowest level since 2020. However, prices have rallied back above US$2/MMBtu since, with the prospect of flat supply growth this year and stronger demand for 2024 and 2025. While we expect US natural gas prices to trend higher, there are risks to this view, mainly due to comfortable storage levels and the potential for associated gas production surprising to the upside.
US storage very comfortable
US natural gas storage has become increasingly more comfortable over the 2023/24 winter. Ahead of the heating season, storage in the US was almost 6% higher YoY and close to 5% above the 5-year average. However, storage is now 21% higher YoY and 35% above the 5-year average. This shift in storage helps to explain the significant weakness in Henry Hub over the winter months.
Several factors have contributed to lower-than-usual stock draws. Firstly, demand was weaker over the winter months due to milder weather. Residential and commercial demand between November and March averaged a little under 35bcf/day, down 6% YoY. Secondly, there was stronger supply over the period, with domestic output growing 3% YoY to almost 105bcf/d. Finally, maintenance at the Freeport LNG export facility would have also reduced demand for gas, reflected in the lower gas flows to the plant in recent months.
Healthy US natural gas storage (Bcf)

EIA, ING Research Flat US supply growth
The supply growth seen over 2023 and the winter months is not expected to last through 2024. The low-price environment has led to falling drilling activity. Baker Hughes data shows that the US gas rig count has declined 28% YoY to 102 rigs, the lowest count since December 2021. As a result, US dry gas production growth is expected to be largely flat over the year. The EIA forecasts dry gas production to fall 0.2% YoY to 103.6bcf/d in 2024.
Complicating the supply outlook is the growth in associated gas production, which is gas supply from oil wells. The oil rig count has held up better than gas, and stronger oil prices are still supporting drilling activity. Baker Hughes data shows the oil rig count has been steady since October last year. US crude oil supply is also expected to grow modestly in 2024. But if this surprises to the upside (like in 2023), there is potential for further growth in natural gas supply.
US dry gas production growth YoY (Bcf/day)

EIA, ING Research US gas demand to strengthen
Flat supply this year is expected to be accompanied by stronger demand. Firstly, lower prices in the US should support demand from the power sector. Secondly, Freeport should return in May from extended maintenance, and we should see gas demand from the plant return to more normal levels.
Furthermore, there is a large amount of new LNG export capacity starting this year. Plaquemines Phase 1 and Corpus Christi Stage 3 are expected to start over the second half of 2024, and these two projects have a combined capacity of a little over 2.6bcf/d (20mtpa). Further capacity is set to start in 2025, with Golden Pass trains 1 and 2 expected to ramp up operations. These trains have a combined capacity of 1.35bcf/day (10.4mtpa). However, there have been reports more recently that delays could push the start date of this plant into the second half of the year.
Asian LNG demand remains robust
The broader weakness in the global gas and LNG market has seen more price-sensitive buyers in Asia returning after the high price and volatile environment in 2022 and parts of 2023. The region saw imports in the first quarter of 2024 grow 8% YoY, and this growth has only strengthened into the second quarter, with imports in April up 17% YoY, according to LSEG data. These stronger flows are expected to continue due to the lower price environment, warmer weather across large parts of southeast Asia, and new LNG importers entering the market (with the startup of new regasification capacity).
ING natural gas forecasts ING Research
MENAFN07052024000222011065ID1108181775
Author:
Warren Patterson