(MENAFN- PR Newswire)
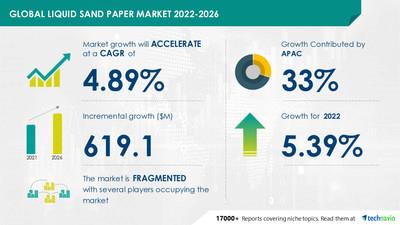
NEW YORK, Sept. 26, 2022 /PRNewswire/ -- The ' by Application (Home, Office, and Industry) and Geography (North America, APAC, Europe, South America, and MEA) - Forecast and Analysis 2022-2026' report has been added to Technavio's offering. The potential growth difference for the liquid sand paper market size between 2021 and 2026 is USD 619.1 million. To get the exact CAGR and the Y-O-Y growth rate,
Market Segmentation
Technavio has announced its latest market research report titled Global Liquid Sand Paper Market 2022-2026
By application, the home segment will be the largest contributor to market growth during the forecast period. Liquid sand paper is a painting tool that is used to refinish surfaces. It is used when surfaces must be trued or corrected to obtain a decorative finish. Liquid sand paper is also used to prepare difficult-to-reach areas and small surfaces. It is used for shaving dry paint runs off newly painted surfaces, scraping excess paint and wood off doors and window openings, and reshaping details in existing wood trims. Liquid sand paper transforms blistered coatings and damaged surfaces when used appropriately.
The construction sector is shifting its focus on new areas of development, such as the refurbishment of homes, owing to the increasing need for space to build. Liquid sandpaper is used to prepare and refinish the surface during refurbishment projects. Hence, the increasing demand for refurbishment will drive the growth of the liquid sand paper in the home segment during the forecast period.
for additional insights into the contribution of all the segments and regional opportunities in the report.
Key Market Driver
The increasing number of infrastructure projects is driving the growth of the market. The number of infrastructure projects is rising across the world owing to population growth and regulatory support from various government authorities. In developing countries such as the UAE, Saudi Arabia, India, and China, the construction of commercial and residential buildings is increasing. in addition, some countries are increasing their construction spending. The rise in the number of residential and non-residential construction projects across the world is leading to an increase in the demand for paints. Moreover, the demand for artistic, corrosion-resistant, and colorful wall textures is increasing, which will drive the growth of the paint industry. The increasing need to enhance the exteriors of commercial buildings for aesthetic purposes will also fuel the demand for paints. Thus, the rising demand for painting tools and accessories will increase the demand for liquid sandpaper.
Technavio has identified key trends, drivers, and challenges in the market, which will help vendors improve their strategies to stay ahead of their competitors.
Some Companies Mentioned
- ABSOLUTE RESURFACING PTY Ltd
- Akzo Nobel NV
- Allied Piano and Finish LLC
- Ballistic Bowling
- Formax Manufacturing
- Heinrich Konig GmbH and Co. KG
- Konig UK
- KWH Group Ltd
- Neo Tac Inc
- RPM International Inc.
- Sevens Paint and Wallpaper Co
- Swing Paints Ltd
- The Savogran Co.
- Univar Solutions Inc.
- W.M. BARR Co Inc
- Wilson Imperial Co
Want your report customized? and personalize your report according to your needs
Related Reports
by End-user and Geography - Forecast and Analysis 2022-2026: The anti-graffiti coatings market share is expected to increase by USD 20.02 million from 2021 to 2026.
by End-user and Geography - Forecast and Analysis 2022-2026: The paint protection film market is projected to grow by USD 103.46 million from 2021 to 2026.
| Liquid Sand Paper Market Scope |
| Report Coverage | Details |
| Page number | 120 |
| Base year | 2021 |
| Forecast period | 2022-2026 |
| Growth momentum & CAGR | Accelerate at a CAGR of 4.89% |
| Market growth 2022-2026 | USD 619.1 million |
| Market structure | Fragmented |
| YoY growth (%) | 5.39 |
| Regional analysis | North America, APAC, Europe, South America, and MEA |
| Performing market contribution | APAC at 33% |
| Key consumer countries | US, Canada, China, India, and Germany |
| Competitive landscape | Leading companies, competitive strategies, consumer engagement scope |
| Companies profiled | ABSOLUTE RESURFACING PTY Ltd, Akzo Nobel NV, Allied Piano and Finish LLC, Ballistic Bowling, Formax Manufacturing, Heinrich Konig GmbH and Co. KG, Konig UK, KWH Group Ltd, Neo Tac Inc, RPM International Inc., Sevens Paint and Wallpaper Co, Swing Paints Ltd, The Savogran Co., Univar Solutions Inc., W.M. BARR Co Inc, and Wilson Imperial Co |
| Market Dynamics | Parent market analysis, market growth inducers and obstacles, fast-growing and slow-growing segment analysis, COVID-19 impact and future consumer dynamics, and market condition analysis for the forecast period. |
| Customization purview | If our report has not included the data that you are looking for, you can reach out to our analysts and get segments customized. |
Browse Market Reports
Key Topics Covered
1 Executive Summary
- 1.1 Market overview
- Exhibit 01: Executive Summary – Chart on Market Overview
- Exhibit 02: Executive Summary – Data Table on Market Overview
- Exhibit 03: Executive Summary – Chart on Global Market Characteristics
- Exhibit 04: Executive Summary – Chart on Market by Geography
- Exhibit 05: Executive Summary – Chart on Market Segmentation by Application
- Exhibit 06: Executive Summary – Chart on Incremental Growth
- Exhibit 07: Executive Summary – Data Table on Incremental Growth
- Exhibit 08: Executive Summary – Chart on Vendor Market Positioning
2 Market Landscape
- 2.1 Market ecosystem
- Exhibit 09: Parent market
- Exhibit 10: Market Characteristics
3 Market Sizing
- 3.1 Market definition
- Exhibit 11: Offerings of vendors included in the market definition
- 3.2 Market segment analysis
- Exhibit 12: Market segments
- 3.4 Market outlook: Forecast for 2021-2026
- Exhibit 13: Chart on Global - Market size and forecast 2021-2026 ($ million)
- Exhibit 14: Data Table on Global - Market size and forecast 2021-2026 ($ million)
- Exhibit 15: Chart on Global Market: Year-over-year growth 2021-2026 (%)
- Exhibit 16: Data Table on Global Market: Year-over-year growth 2021-2026 (%)
4 Five Forces Analysis
- 4.1 Five forces summary
- Exhibit 17: Five forces analysis - Comparison between 2021 and 2026
- 4.2 Bargaining power of buyers
- Exhibit 18: Chart on Bargaining power of buyers – Impact of key factors 2021 and 2026
- 4.3 Bargaining power of suppliers
- Exhibit 19: Bargaining power of suppliers – Impact of key factors in 2021 and 2026
- 4.4 Threat of new entrants
- Exhibit 20: Threat of new entrants – Impact of key factors in 2021 and 2026
- 4.5 Threat of substitutes
- Exhibit 21: Threat of substitutes – Impact of key factors in 2021 and 2026
- 4.6 Threat of rivalry
- Exhibit 22: Threat of rivalry – Impact of key factors in 2021 and 2026
- 4.7 Market condition
- Exhibit 23: Chart on Market condition - Five forces 2021 and 2026
5 Market Segmentation by Application
- 5.1 Market segments
- Exhibit 24: Chart on Application - Market share 2021-2026 (%)
- Exhibit 25: Data Table on Application - Market share 2021-2026 (%)
- 5.2 Comparison by Application
- Exhibit 26: Chart on Comparison by Application
- Exhibit 27: Data Table on Comparison by Application
- 5.3 Home - Market size and forecast 2021-2026
- Exhibit 28: Chart on Home - Market size and forecast 2021-2026 ($ million)
- Exhibit 29: Data Table on Home - Market size and forecast 2021-2026 ($ million)
- Exhibit 30: Chart on Home - Year-over-year growth 2021-2026 (%)
- Exhibit 31: Data Table on Home - Year-over-year growth 2021-2026 (%)
- 5.4 Office - Market size and forecast 2021-2026
- Exhibit 32: Chart on Office - Market size and forecast 2021-2026 ($ million)
- Exhibit 33: Data Table on Office - Market size and forecast 2021-2026 ($ million)
- Exhibit 34: Chart on Office - Year-over-year growth 2021-2026 (%)
- Exhibit 35: Data Table on Office - Year-over-year growth 2021-2026 (%)
- 5.5 Industry - Market size and forecast 2021-2026
- Exhibit 36: Chart on Industry - Market size and forecast 2021-2026 ($ million)
- Exhibit 37: Data Table on Industry - Market size and forecast 2021-2026 ($ million)
- Exhibit 38: Chart on Industry - Year-over-year growth 2021-2026 (%)
- Exhibit 39: Data Table on Industry - Year-over-year growth 2021-2026 (%)
- 5.6 Market opportunity by Application
- Exhibit 40: Market opportunity by Application ($ million)
6 Customer Landscape
- 6.1 Customer landscape overview
- Exhibit 41: Analysis of price sensitivity, lifecycle, customer purchase basket, adoption rates, and purchase criteria
7 Geographic Landscape
- 7.1 Geographic segmentation
- Exhibit 42: Chart on Market share by geography 2021-2026 (%)
- Exhibit 43: Data Table on Market share by geography 2021-2026 (%)
- 7.2 Geographic comparison
- Exhibit 44: Chart on Geographic comparison
- Exhibit 45: Data Table on Geographic comparison
- 7.3 North America - Market size and forecast 2021-2026
- Exhibit 46: Chart on North America - Market size and forecast 2021-2026 ($ million)
- Exhibit 47: Data Table on North America - Market size and forecast 2021-2026 ($ million)
- Exhibit 48: Chart on North America - Year-over-year growth 2021-2026 (%)
- Exhibit 49: Data Table on North America - Year-over-year growth 2021-2026 (%)
- 7.4 APAC - Market size and forecast 2021-2026
- Exhibit 50: Chart on APAC - Market size and forecast 2021-2026 ($ million)
- Exhibit 51: Data Table on APAC - Market size and forecast 2021-2026 ($ million)
- Exhibit 52: Chart on APAC - Year-over-year growth 2021-2026 (%)
- Exhibit 53: Data Table on APAC - Year-over-year growth 2021-2026 (%)
- 7.5 Europe - Market size and forecast 2021-2026
- Exhibit 54: Chart on Europe - Market size and forecast 2021-2026 ($ million)
- Exhibit 55: Data Table on Europe - Market size and forecast 2021-2026 ($ million)
- Exhibit 56: Chart on Europe - Year-over-year growth 2021-2026 (%)
- Exhibit 57: Data Table on Europe - Year-over-year growth 2021-2026 (%)
- 7.6 South America - Market size and forecast 2021-2026
- Exhibit 58: Chart on South America - Market size and forecast 2021-2026 ($ million)
- Exhibit 59: Data Table on South America - Market size and forecast 2021-2026 ($ million)
- Exhibit 60: Chart on South America - Year-over-year growth 2021-2026 (%)
- Exhibit 61: Data Table on South America - Year-over-year growth 2021-2026 (%)
- 7.7 Middle East and Africa - Market size and forecast 2021-2026
- Exhibit 62: Chart on Middle East and Africa - Market size and forecast 2021-2026 ($ million)
- Exhibit 63: Data Table on Middle East and Africa - Market size and forecast 2021-2026 ($ million)
- Exhibit 64: Chart on Middle East and Africa - Year-over-year growth 2021-2026 (%)
- Exhibit 65: Data Table on Middle East and Africa - Year-over-year growth 2021-2026 (%)
- 7.8 US - Market size and forecast 2021-2026
- Exhibit 66: Chart on US - Market size and forecast 2021-2026 ($ million)
- Exhibit 67: Data Table on US - Market size and forecast 2021-2026 ($ million)
- Exhibit 68: Chart on US - Year-over-year growth 2021-2026 (%)
- Exhibit 69: Data Table on US - Year-over-year growth 2021-2026 (%)
- 7.9 China - Market size and forecast 2021-2026
- Exhibit 70: Chart on China - Market size and forecast 2021-2026 ($ million)
- Exhibit 71: Data Table on China - Market size and forecast 2021-2026 ($ million)
- Exhibit 72: Chart on China - Year-over-year growth 2021-2026 (%)
- Exhibit 73: Data Table on China - Year-over-year growth 2021-2026 (%)
- 7.10 India - Market size and forecast 2021-2026
- Exhibit 74: Chart on India - Market size and forecast 2021-2026 ($ million)
- Exhibit 75: Data Table on India - Market size and forecast 2021-2026 ($ million)
- Exhibit 76: Chart on India - Year-over-year growth 2021-2026 (%)
- Exhibit 77: Data Table on India - Year-over-year growth 2021-2026 (%)
- 7.11 Germany - Market size and forecast 2021-2026
- Exhibit 78: Chart on Germany - Market size and forecast 2021-2026 ($ million)
- Exhibit 79: Data Table on Germany - Market size and forecast 2021-2026 ($ million)
- Exhibit 80: Chart on Germany - Year-over-year growth 2021-2026 (%)
- Exhibit 81: Data Table on Germany - Year-over-year growth 2021-2026 (%)
- 7.12 Canada - Market size and forecast 2021-2026
- Exhibit 82: Chart on Canada - Market size and forecast 2021-2026 ($ million)
- Exhibit 83: Data Table on Canada - Market size and forecast 2021-2026 ($ million)
- Exhibit 84: Chart on Canada - Year-over-year growth 2021-2026 (%)
- Exhibit 85: Data Table on Canada - Year-over-year growth 2021-2026 (%)
- 7.13 Market opportunity by geography
- Exhibit 86: Market opportunity by geography ($ million)
8 Drivers, Challenges, and Trends
- 8.3 Impact of drivers and challenges
- Exhibit 87: Impact of drivers and challenges in 2021 and 2026
9 Vendor Landscape
- 9.2 Vendor landscape
- Exhibit 88: Overview on Criticality of inputs and Factors of differentiation
- 9.3 Landscape disruption
- Exhibit 89: Overview on factors of disruption
- 9.4 Industry risks
- Exhibit 90: Impact of key risks on business
10 Vendor Analysis
- 10.1 Vendors covered
- Exhibit 91: Vendors covered
- 10.2 Market positioning of vendors
- Exhibit 92: Matrix on vendor position and classification
- 10.3 ABSOLUTE RESURFACING PTY Ltd
- Exhibit 93: ABSOLUTE RESURFACING PTY Ltd - Overview
- Exhibit 94: ABSOLUTE RESURFACING PTY Ltd - Product / Service
- Exhibit 95: ABSOLUTE RESURFACING PTY Ltd - Key offerings
- 10.4 Akzo Nobel NV
- Exhibit 96: Akzo Nobel NV - Overview
- Exhibit 97: Akzo Nobel NV - Business segments
- Exhibit 98: Akzo Nobel NV - Key news
- Exhibit 99: Akzo Nobel NV - Key offerings
- Exhibit 100: Akzo Nobel NV - Segment focus
- 10.5 Formax Manufacturing
- Exhibit 101: Formax Manufacturing - Overview
- Exhibit 102: Formax Manufacturing - Product / Service
- Exhibit 103: Formax Manufacturing - Key offerings
- 10.6 Heinrich Konig GmbH and Co. KG
- Exhibit 104: Heinrich Konig GmbH and Co. KG - Overview
- Exhibit 105: Heinrich Konig GmbH and Co. KG - Product / Service
- Exhibit 106: Heinrich Konig GmbH and Co. KG - Key offerings
- 10.7 Konig UK
- Exhibit 107: Konig UK - Overview
- Exhibit 108: Konig UK - Product / Service
- Exhibit 109: Konig UK - Key offerings
- 10.8 KWH Group Ltd
- Exhibit 110: KWH Group Ltd - Overview
- Exhibit 111: KWH Group Ltd - Business segments
- Exhibit 112: KWH Group Ltd - Key offerings
- Exhibit 113: KWH Group Ltd - Segment focus
- 10.9 RPM International Inc.
- Exhibit 114: RPM International Inc. - Overview
- Exhibit 115: RPM International Inc. - Business segments
- Exhibit 116: RPM International Inc. - Key offerings
- Exhibit 117: RPM International Inc. - Segment focus
- 10.10 The Savogran Co.
- Exhibit 118: The Savogran Co. - Overview
- Exhibit 119: The Savogran Co. - Product / Service
- Exhibit 120: The Savogran Co. - Key offerings
- 10.11 W.M. BARR Co Inc
- Exhibit 121: W.M. BARR Co Inc - Overview
- Exhibit 122: W.M. BARR Co Inc - Product / Service
- Exhibit 123: W.M. BARR Co Inc - Key offerings
- 10.12 Wilson Imperial Co
- Exhibit 124: Wilson Imperial Co - Overview
- Exhibit 125: Wilson Imperial Co - Product / Service
- Exhibit 126: Wilson Imperial Co - Key offerings
11 Appendix
- 11.2 Inclusions and exclusions checklist
- Exhibit 127: Inclusions checklist
- Exhibit 128: Exclusions checklist
- 11.3 Currency conversion rates for US$
- Exhibit 129: Currency conversion rates for US$
- 11.4 Research methodology
- Exhibit 130: Research methodology
- Exhibit 131: Validation techniques employed for market sizing
- Exhibit 132: Information sources
- 11.5 List of abbreviations
- Exhibit 133: List of abbreviations
About Us
Technavio is a leading global technology research and advisory company. Their research and analysis focus on emerging market trends and provide actionable insights to help businesses identify market opportunities and develop effective strategies to optimize their market positions.
With over 500 specialized analysts, Technavio's report library consists of more than 17,000 reports and counting, covering 800 technologies, spanning across 50 countries. Their client base consists of enterprises of all sizes, including more than 100 Fortune 500 companies. This growing client base relies on Technavio's comprehensive coverage, extensive research, and actionable market insights to identify opportunities in existing and potential markets and assess their competitive positions within changing market scenarios.
Contact Technavio ResearchJesse MaidaMedia & Marketing ExecutiveUS: +1 844 364 1100UK: +44 203 893 3200Email: Website:
SOURCE Technavio
MENAFN26092022003732001241ID1104928741
Legal Disclaimer:
MENAFN provides the information “as is” without warranty of any kind. We do not accept any responsibility or liability for the accuracy, content, images, videos, licenses, completeness, legality, or reliability of the information contained in this article. If you have any complaints or copyright issues related to this article, kindly contact the provider above.