(MENAFN- DailyFX) 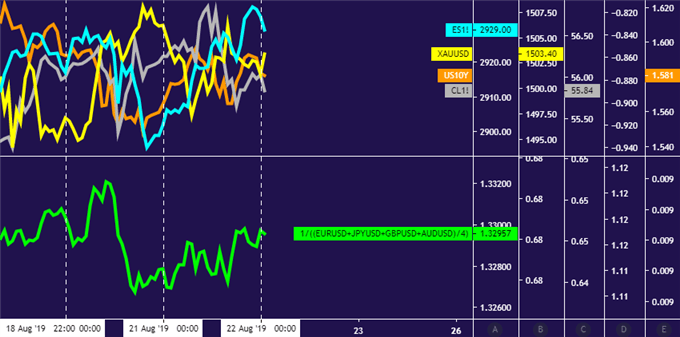
Crude oil,gold priceperformance chart created usingTradingView
GOLD & CRUDE OIL TALKING POINTS:Gold prices mark time as all eyes turn to Jackson Hole symposium Downturn may be in the cards as Powell cools rate cut speculation ECB minutes, Eurozone PMI data may struggle for follow-through
The release ofminutes from July's FOMC meetingdid not inspire a strong response from financial markets. While the document reiterated that the central bank sees last month's rate cut as a 'mid-cycle adjustment' – downplaying scope for follow-on easing – stimulus-hungry financial markets refused to relent.
Indeed, Fed Funds futures still imply 50-75bps in further easing before year-end. Investors' defiant stance probably reflects lingering hope that the dated Minutes document will be superseded by promises of lavish accommodation to be unveiled at the US central bank's symposium in Jackson Hole, Wyoming.
The gathering gets underway today, but the main event comes on Friday when Fed Chair Powell steps up to the microphone. The bar to exceed the markets' ultra-dovish baseline outlook seems exceedingly high while the risk of disappointment appears outsized against the backdrop of still-solid economic data.
That probably bodes ill for gold. The appeal of the non-yielding metal is likely to be diminished if Mr Powell and company appear unwilling to commit to big-splash rate reduction. Cycle-geared crude oil prices look likewise vulnerable as fading faith in policy support sours market-wide risk appetite.
Directional conviction may be absent in the meanwhile. July ECB meeting minutes could cheer investors a bit if the central bank telegraphs fireworks with its own stimulus boost – a move whose likelihood might be reinforced by soft Eurozone PMI data – but Jackson Hole anticipation may contain follow-through.
Get our free guide to helpbuild confidence in your gold and crude oil trading strategy !
GOLD TECHNICAL ANALYSIS
Gold prices are still treading water below August's high at 1535.03 but negative RSI divergence warns a turn lower may be ahead. A daily close below initial support at 1480.00 opens the door for a test of the 1437.70-52.95 area. Alternatively, a break of resistance targets a weekly chart inflection level at 1563.00.
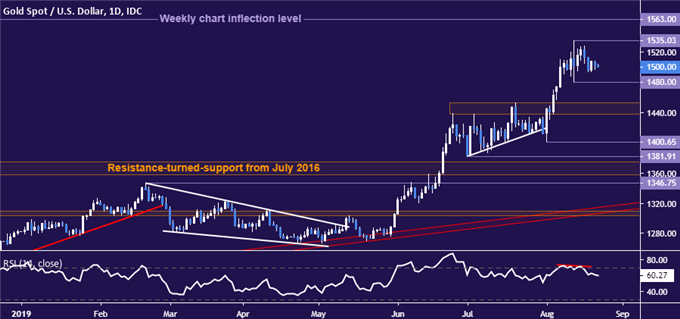
Gold price chart created usingTradingView
CRUDE OIL TECHNICAL ANALYSIS
Crude oil pricesare still grinding against resistance set from late April, now at 58.18. A daily close above that targets the 60.04-84 zone next. Alternatively, a reversal back below the 53.95-54.84 congestion area sets the stage to challenge the $50/bbl figure once more.
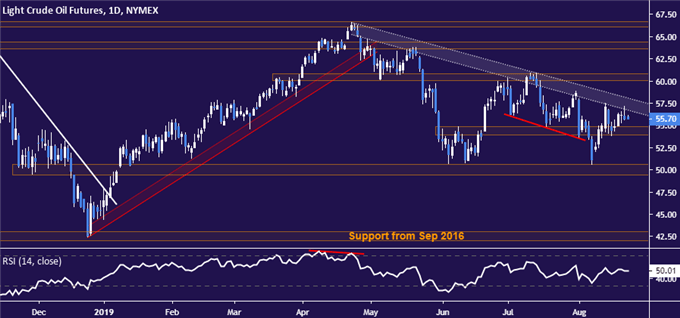
Crude oil price chart created usingTradingView
COMMODITY TRADING RESOURCESSee our guide to learn about thelong-term forces driving crude oil prices Having trouble with your strategy? Here's the#1 mistake that traders makeJoin a free webinarand have your commodity market questions answered
--- Written by Ilya Spivak, Currency Strategist for DailyFX.com
To contact Ilya, use the comments section below or@IlyaSpivakon Twitter
DailyFX
MENAFN2208201900760000ID1098911347
Legal Disclaimer:
MENAFN provides the information “as is” without warranty of any kind. We do not accept any responsibility or liability for the accuracy, content, images, videos, licenses, completeness, legality, or reliability of the information contained in this article. If you have any complaints or copyright issues related to this article, kindly contact the provider above.