


403
Sorry!!
Error! We're sorry, but the page you were looking for doesn't exist.

Oil Price Chart: Crude Crushed Down to Support WTI Trade Levels
(MENAFN- DailyFX) Crude Oil pricebreakdown approaching initial support hurdles- shorts vulnerable near-term Check out our 2019 projections in ourFree DailyFX Crude Oil Trading Forecasts Join Michael for Live Weekly Strategy Webinars onMondays at 12:30GMT 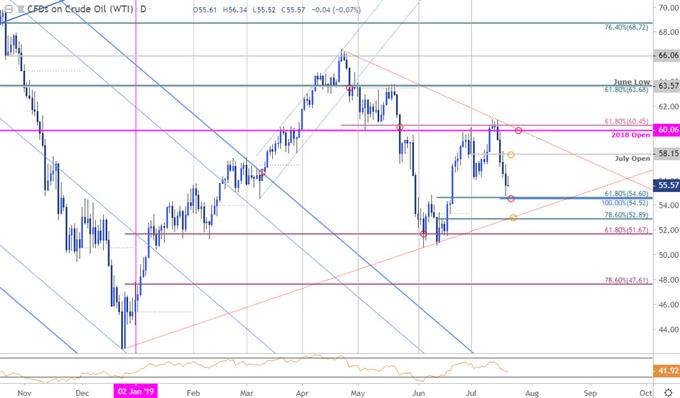

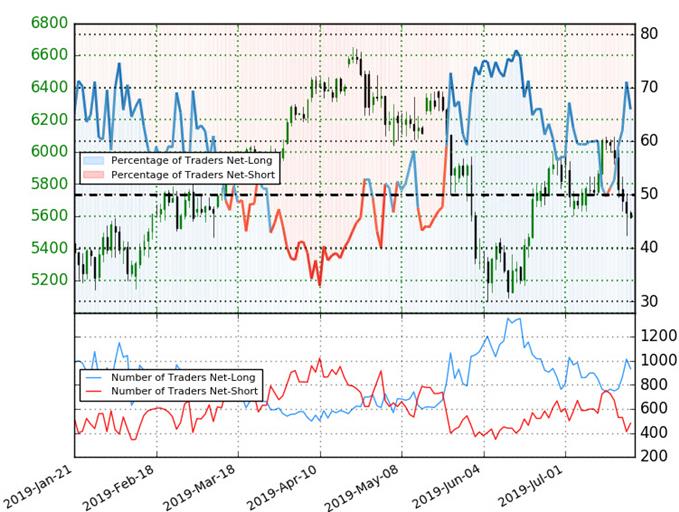 A summary ofIG Client Sentimentshows traders are net-long Crude Oil - the ratio stands at +1.94 (66.0% of traders are long) – bearish reading Long positions are 3.5% higher than yesterday and 22.3% higher from last week Short positions are 4.6% lower than yesterday and 34.4% lower from last week We typically take a contrarian view to crowd sentiment, and the fact traders are net-long suggests Oil prices may continue to fall. Traders are further net-long than yesterday & last week, and the combination of current positioning and recent changes gives us a stronger Oil - US Crude-bearish contrarian trading bias from a sentiment standpoint.
Crude Oil Pricesare poised to mark a sixth consecutive daily decline today if price closes at these levels with the sell-off now targeting the first major support zone just lower. These are the updated targets and invalidation levels that matter on thecrude oilprice charts (WTI).Review this week's Strategy Webinarfor an in-depth breakdown of this oil price setup and more.
New to Oil Trading? Get started with this FreeHow to Trade Crude Oil Beginners Guide
Crude Oil Price Chart - WTI Daily Technical Outlook: In my latestOil Price Weekly Outlookwe noted, 'the immediate oil price advance is vulnerable while below confluence resistance at 60.06/47. From a trading standpoint, a good place to reduce long-exposure / raise protective stops. Be on the lookout for possible topside exhaustion to give way to a larger pullback in crude.' The subsequent five-day sell-off has now broken below the monthly open support and the objective Julyopening-rangelows and leaves the risk for further losses heading into the close of the month.
That said, the immediate decline is now approaching initial areas of support which could interrupt the current oil price breakdown. Confluence support rests at 54.52/60 backed by the Decembertrendline/ 78.6%retracementat 52.89- both areas of interest for near-term exhaustion.
Why does the average trader lose?Avoid these Mistakes in your trading
Crude Oil Price Chart – WTI 240min Notes: A closer look at oil price action shows WTI posting a 4-hour outside-reversal bar off key resistance at 60.06/45 early in the week with the decline trading within the confines of a well-defineddescendingpitchfork formation . Initial resistance at the median-line / monthly opening-range lows at 56.03/28 with broader bearish invalidation now lowered to the July open at 58.15. A break below the 54.52/60 support zone exposes subsequent downside objectives at 52.89 and 51.67- look for a bigger reaction there IF reached.
Learn how to Trade with Confidence in our Free Trading Guide
Bottom line: The oil price sell-off is approaching the first major support target and while the broader risk remains lower, the immediate decline may be vulnerable heading into 54.52/60. From a trading standpoint, a good spot to reduce short-exposure / lower protective stops – we'll be on the lookout for possible downside exhaustion on a stretch lower.
For a complete breakdown of Michael's trading strategy, review hisFoundations of Technical Analysis series on Building a Trading Strategy
Crude Oil Trader Sentiment (WTI) A summary ofIG Client Sentimentshows traders are net-long Crude Oil - the ratio stands at +1.94 (66.0% of traders are long) – bearish reading Long positions are 3.5% higher than yesterday and 22.3% higher from last week Short positions are 4.6% lower than yesterday and 34.4% lower from last week We typically take a contrarian view to crowd sentiment, and the fact traders are net-long suggests Oil prices may continue to fall. Traders are further net-long than yesterday & last week, and the combination of current positioning and recent changes gives us a stronger Oil - US Crude-bearish contrarian trading bias from a sentiment standpoint. See how shifts in Crude Oil retail positioning are impacting trend-Learn more about sentiment!
---
Active Trade Setups Gold Price Chart: XAU/USD Approaching Range Highs– Battle Lines Drawn Sterling Price Chart: British Pound Testing Post-Brexit Support Canadian Dollar Price Chart: Loonie Drives USD/CAD to Weekly Support Aussie Weekly Price Chart: Australian Dollar Testing Key Resistance- Written byMichael Boutros , Currency Strategist with DailyFX
Follow Michael on Twitter@MBForex
DailyFX

Legal Disclaimer:
MENAFN provides the
information “as is” without warranty of any kind. We do not accept
any responsibility or liability for the accuracy, content, images,
videos, licenses, completeness, legality, or reliability of the information
contained in this article. If you have any complaints or copyright
issues related to this article, kindly contact the provider above.
Most popular stories
Market Research

More Story


Comments
No comment