(MENAFN- DailyFX) US Dollar, EUR/USD, GBP/USD, AUD/USD, USD/CAD Talking Points: The June sell-off in the US Dollar has come into question after a bouncedeveloped around the Q3 open. Sellers made another push this week, but will they be able to continue driving down to fresh lows? After a week of Fed-speak combined with the Humphrey Hawkins testimony fromFOMCChair, Jerome Powell, the stage is set for continued USD-volatility as a short-term theme of strength that's shown over the past two weeks runs counter to an intermediate-term scenario of weakness. WillUSDbulls or bears end up taking control of prices in the second-half of July? DailyFX Forecasts are published on a variety of markets such asGold , theUS Dollarorthe Euroand are available from theDailyFX Trading Guides page . If you're looking to improve your trading approach, check outTraits of Successful Traders . And if you're looking for an introductory primer to the Forex market, check out ourNew to FX Guide . US Dollar Starts Q3 with Strength After Bearish Close to Q2
It's been an interesting start to Q3 trade for the US Dollar . After the currency turned-over in the month of June, largely on the back of a dovish-flip at the Fed, the first week of July saw prices bounce-higher. That theme of USD-strength lasted into the first couple days of this week,until the Jerome Powell Humphrey Hawkins testimony on Wednesday , when weakness re-emerged on the back of another dovish tilt from the FOMC Chair.
Yesterday'sprice actionsaw the US Dollar catch support around a prior area of resistance, and this keeps the door open for short-term themes of strength.
US Dollar Two-Hour Price Chart
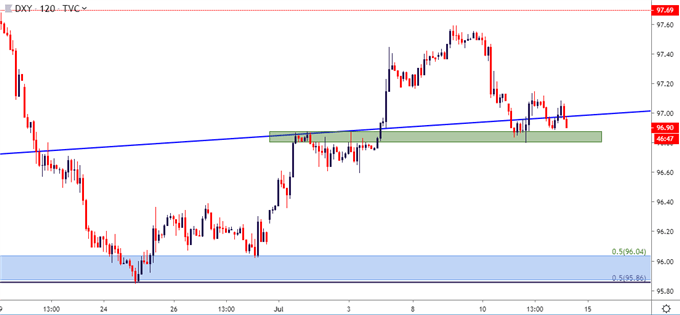
Chart prepared byJames Stanley
On a longer-term or bigger picture basis, the more attractive side of the currency would likely be bearish.This would emanate from the recent break-below the rising wedge formation , combined with the support bounce in the Greenback coming in at a very logical area on the chart. The three-month-low in the US Dollar was set three weeks ago at 95.86, which is the 50% marker of the 2001-2008 major move in the currency. This price can function as future targets for short-side plays in theDXYindex; and that scenario can be extrapolated to potential themes of USD-weakness in pairs looked at below such asEUR/USDorUSD/CAD .
US Dollar Weekly Price Chart
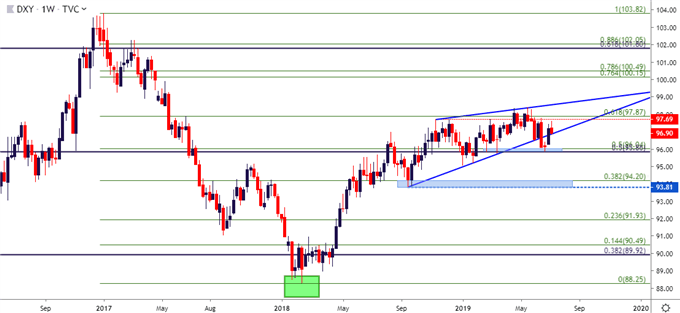
Chart prepared byJames Stanley
EUR/USD Holds Support at Key Zone as Short Squeeze Potential Remains
On the short-side of the US Dollar, EUR/USD remains of interest. And to be sure, this isn't necessarily because of any positive events around Europe; but more owed to the elongated bearish move that produced a series of bear traps in the month of May. That led into a strong month of June, andthat strength has thus far continued to carry overtones into July trade as the pair has continued to hold higher-low support .
Should the US Dollar continue to sell-off on the back of dovish expectations around the Federal Reserve, the topside of EUR/USD remains of interest as there are likely more long-term EUR/USD short positions that could be further squeezed by that USD-weakness. This week saw a hold of support at a higher low, coming in around the support zone that runs from 1.1187-1.1212. As long as prices remain above those supports, the door remains open for topside, and bullish target potential exists around the 1.1325 zone of prior resistance, followed by 1.1380 and then the longer-term zone of range resistance that runs from 1.1448-1.1500.
EUR/USD Eight-Hour Price Chart
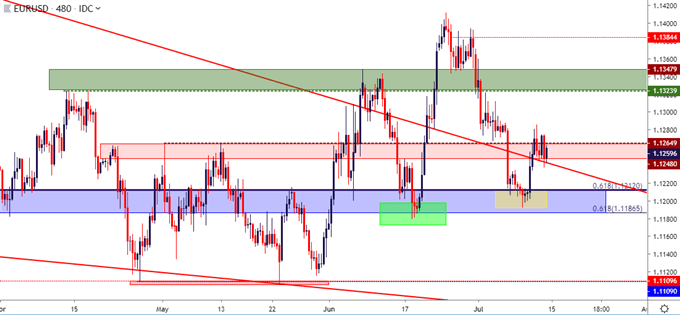
Chart prepared byJames Stanley
GBP/USD: Cable Snaps Back After Bears Thwarted at Flash Crash Lows
The year started in a very bearish manner inGBP/USD . The pair posed a 'flash crash' in the opening days of 2019 to slide all the way down to the 1.2442 level. That move didn't last for long, as bargain buyers came-in to pose a push off the lows, and by mid-Marchprice actionhad already re-claimed ground above the 1.3300-handle. Since then, however, matters haven't been quite as positive: A brutal month of May saw bears retain control for most of the period, with prices breaking-below a number of supports along the way.
GBP/USD bears have remained in-charge through the July/Q3 open, and prices have pushed all the way down to a fresh 2019 low, finding support on Tuesday of this week around that prior flash-crash inflection point. Since then, prices have been retracing; and this opens the door for short-side trend strategies, particularly for traders looking at a return of US Dollar strength. The big operative for that theme at this point would be picking out the spot of lower-high resistance to best strike upon. On the below chart, two potential zones are investigated; and resistance showing at either re-opens the door for bearish strategies in the pair.
GBP/USD Four-Hour Price Chart
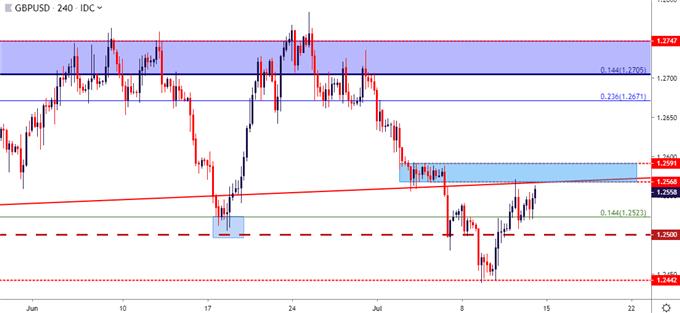
Chart prepared byJames Stanley
AUD/USD Re-Tests Key Resistance at .7000 Big Figure
Also of interest on the side of USD-strength scenarios is the short-side ofAUD/USD . The pair has posed a brisk push-higher this week on the back of that USD-weakness, helping prices to re-engage with a key zone of resistance on the chart that runs from .7000-.7020.This zone has been in-play in various ways over the past two months, helping to set numerous resistance inflections . This sets up a fairly interesting scenario for themes of USD-strength: If Dollar bulls can make a forward-push, the bearish side of AUD/USD is of interest. Potential stop placement could be investigated above the two-month-high that came into play last week at .7048. Short-side target potential exists around prior zones of support at .6955-.6960, followed by the .6903-.6911 zone that came into play on Wednesday. Beyond that, additional target potential exists around .6850, followed by bearish breakdown potential below that.
AUD/USD Eight-Hour Price Chart
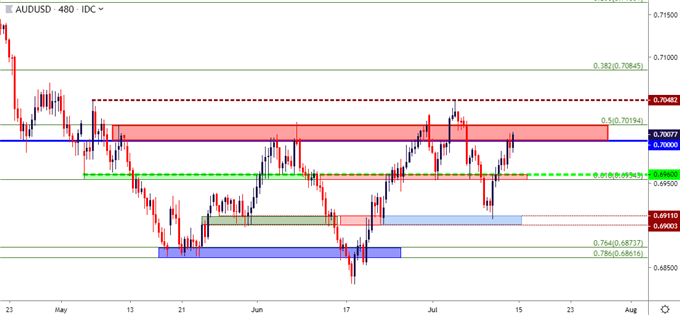
Chart prepared byJames Stanley
USDCAD Brings Breakdown Potential as Weak USD Meets Strong CAD
Back on the short-side of the US Dollar, USD/CAD remains of interest. When last month's ramp of US Dollar weakness showed up around the Federal Reserve, USD/CAD put in a strong bearish move as theCanadian Dollarwas catching a bid following a release of strong inflation numbers. Should US Dollar weakness continue to show with prominence, the short-side of USD/CAD can remain of interest. I had looked at bearish breakout plays in the pair a couple of weeks ago,with a breach of the 1.3132 Fibonacci level to lead to a run down to another Fibonacci level at 1.3065 . That move filled-in in short order, and since then prices have shown a build of support above the 1.3000 psychological level.
USD/CAD Four-Hour Price Chart
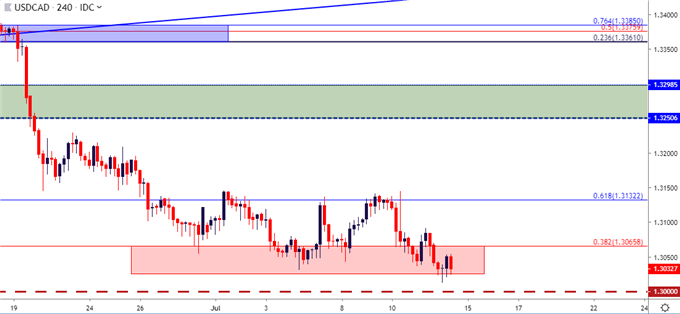
Chart prepared byJames Stanley
A pullback to resistance at prior support can re-open the door for bearish plays in the pair. This can be sought out at that 1.3065 level up to yesterday's swing-high, which comes in around the 1.3100-handle. This can allow for stop placement above the July highs, with initial targets set to the 1.3000 big figure; and if that can break in short-order, secondary target potential exists at the Fibonacci level of 1.2928.
USD/CAD Daily Price Chart
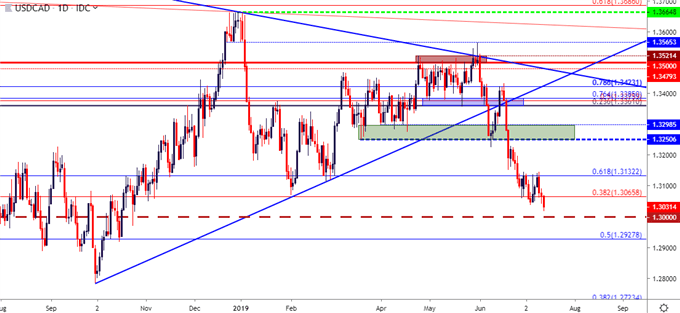
Chart prepared byJames Stanley
To read more:
Are you looking for longer-term analysis on the U.S. Dollar? OurDailyFX Forecasts have a section for each major currency, and we also offer a plethora of resources onGoldorUSD -pairs such asEUR/USD ,GBP/USD ,USD/JPY ,AUD/USD . Traders can also stay up with near-term positioning via ourIG Client Sentiment Indicator .
Forex Trading Resources
DailyFX offers an abundance of tools, indicators and resources to help traders. For those looking for trading ideas, ourIG Client Sentimentshows the positioning of retail traders with actual live trades and positions. Ourtrading guidesbring our DailyFX Quarterly Forecasts and our Top Trading Opportunities; and ourreal-time news feedhas intra-day interactions from the DailyFX team. And if you're looking for real-time analysis, ourDailyFX Webinarsoffer numerous sessions each week in which you can see how and why we're looking at what we're looking at.
If you're looking for educational information, ourNew to FX guideis there to help new(er) traders while ourTraits of Successful Traders researchis built to help sharpen the skill set by focusing on risk and trade management.
--- Written by James Stanley, Strategist for DailyFX.com
Contact and follow James on Twitter:@JStanleyFX
MENAFN1207201900760000ID1098751877
Legal Disclaimer:
MENAFN provides the information “as is” without warranty of any kind. We do not accept any responsibility or liability for the accuracy, content, images, videos, licenses, completeness, legality, or reliability of the information contained in this article. If you have any complaints or copyright issues related to this article, kindly contact the provider above.