(MENAFN- Daily Forex) Bearish view
Sell the BTC/USD pair and set a take-profit at 62,500. Add a stop-loss at 63,400. Timeline: 1-2 days.
Bullish view
Set a buy-stop at 66,000 and a take-profit at 68,400. Add a stop-loss at 63,000.

Bitcoin and other altcoins remained under pressure this week as the recent bullish momentum faded. The BTC/USD pair was trading at 65,865, much lower than the year-to-date high of 73,745. It is hovering at its lowest level since March 24th outflows are continuing
Bitcoin has continued struggling in the past few weeks as concerns about the ongoing outflows from the Grayscale Bitcoin Trust (GBTC), the biggest ETF in the industry. The fund has shed assets in all weeks since January. It has shed over $14.9 billion in assets as investors move to the other cheaper alternatives. It has lost more than $407 million this week.
The other important reason is that the US government may auction thousands of Bitcoins, which it recovered following the collapse of Silk Road. The wallet holding these coins, which are worth over $2 billion, completed several transactions this week. As a result, this liquidation could lead to more Bitcoin supply, which could affect its price.
Forex Brokers We Recommend in Your Region See full brokers list 1 Read full review Get Started
Bitcoin's underperformance has coincided with the performance of American equities. The Dow Jones retreated by 115 points on Wednesday while the S&P 500 and Nasdaq 100 dropped by about 0.10%. They have dropped in the past three straight days.
The BTC/USD pair retreated even as the US dollar index (DXY) plunged in the overnight session. The index dropped by 52 basis points and moved to $104. This decline happened after Jerome Powell hinted that the bank will still start cutting interest rates later this year.
The other crucial event will be the upcoming Bitcoin halving event scheduled for later this month. Halving will reduce the amount of Bitcoin produced per day by slashing the rewards offered to miners/USD technical analysis
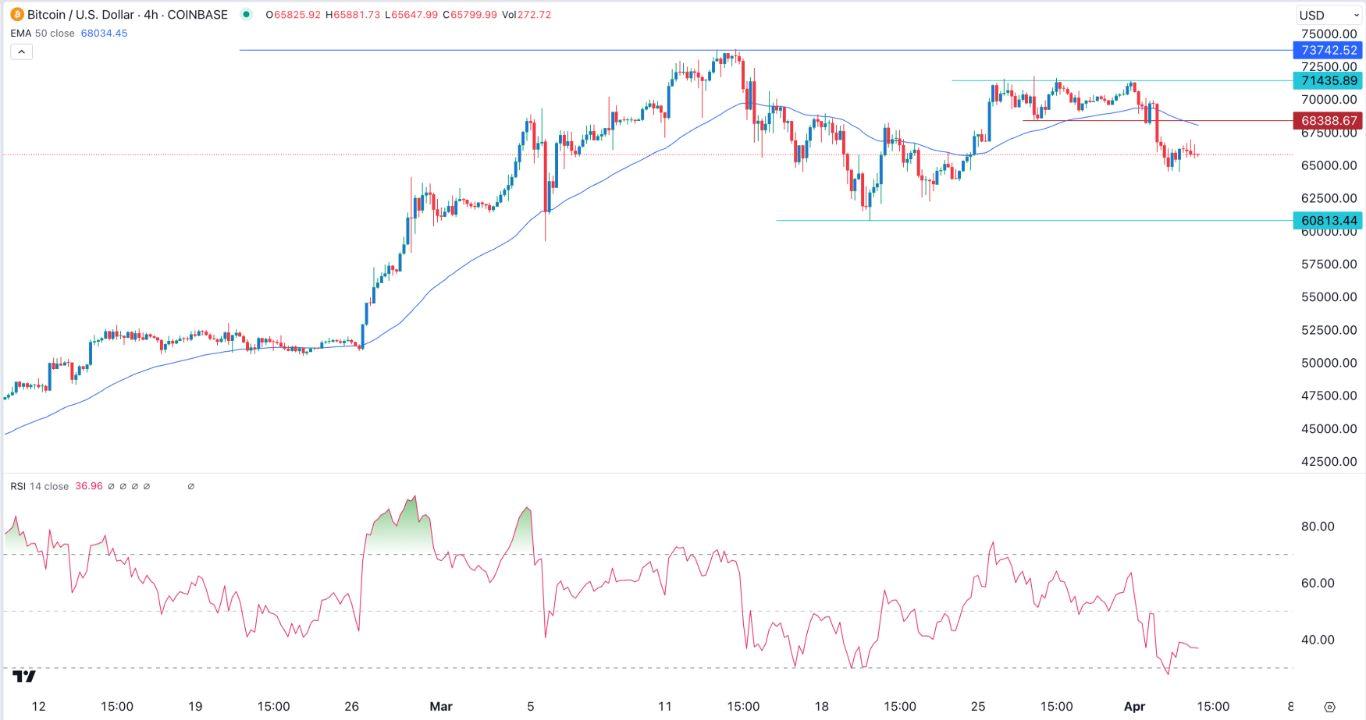
The BTC/USD pair topped at 71,435 since March 25th, where it struggled to move above. It formed a triple-bottom pattern , which is one of the most bearish signs. The pair has moved below the important support level at 68,388 on Monday.
Bitcoin has also formed a bearish pennant pattern, which is negative sign. It has also moved below the 50-period Exponential Moving Average (EMA) . The Relative Strength Index (RSI has retreated below the neutral point.
Therefore, the outlook for the pair is extremely bearish , with the next point to watch being at 62,000. The stop-loss for this trade will be at 68,400.
Ready to trade our free daily Forex trading signals ? We've shortlisted the best MT4 crypto brokers in the industry for you.
MENAFN04042024000131011023ID1108057690
Legal Disclaimer:
MENAFN provides the information “as is” without warranty of any kind. We do not accept any responsibility or liability for the accuracy, content, images, videos, licenses, completeness, legality, or reliability of the information contained in this article. If you have any complaints or copyright issues related to this article, kindly contact the provider above.