(MENAFN- DailyFX)
S & P 500 Price Outlook:
- The has broken beneath an important trendline from March 2020 as losses mount
- Broader risk appetite has soured technology stocks, cryptocurrencies and other ''risky” assets
-
S & P 500 Forecast: Stocks at Risk Following Major Trendline Break
The S & P 500 is teetering on the brink of deeper declines after a major trendline break sent the index seeking support near the 50-day moving average. Inflationary fears and expectations of hawkish monetary policy as a result of those fears have worked to quell risk appetite in recent sessions, sending equities, cryptocurrencies and growth-sensitive currencies lower. While high-flying technology stocks of the 100 have experienced the deepest declines, the S & P 500’s trendline break is a concerning development for broader equity valuations.
S & P 500 Price Chart: Daily Time Frame (January 2020 – May 2021)
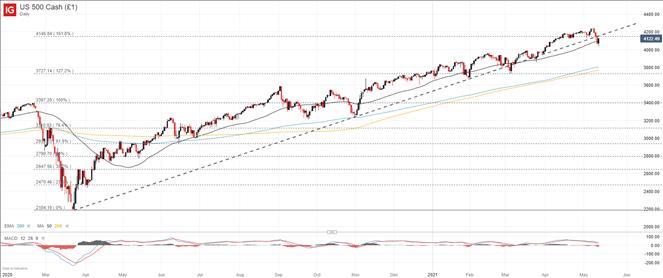
The trendline in question is derived from the index’s pandemic low in March 2020 and has influenced price throughout the time since, although a brief break was suffered in early March 2021. Coupled with more recent weakness, it would seem the level is quickly losing its ability to keep price afloat which may open the door to further losses. Already the S & P 500 has sought support from the nearby 50-day simple moving average.
With an important trendline disposed of and the 50-day under fire, tertiary support might be required in the days ahead. The psychologically significant 4,000 mark could offer some buoyancy to start, while a break beneath the round number could see price crater to the 200-day moving average and Fibonacci support in the 3,800 to 3,730 range.
S & P 500 Client Sentiment and Price Chart
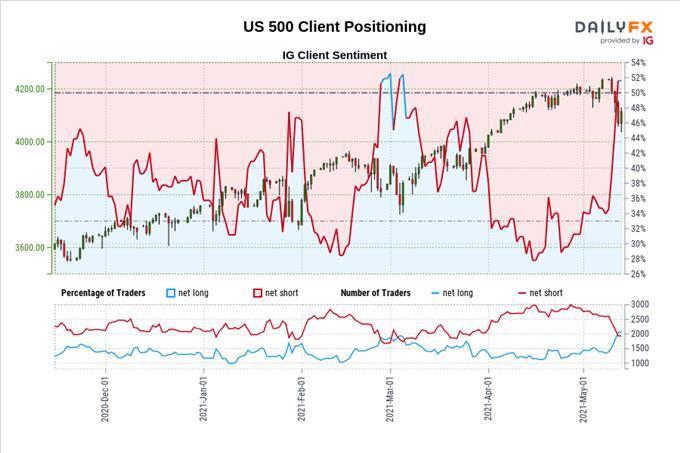
With that in mind, client positioning data may suggest further losses are in store as retail traders at IG have flipped net-long the S & P 500 for the first time since early March. Since we typically take a contrarian view to crowd sentiment, the flip to net-long may suggest the index will continue to fall. In the meantime, follow on Twitter for updates and analysis.
--Written by Peter Hanks, Strategist for DailyFX.com
Contact and follow Peter on Twitter
MENAFN13052021000076011015ID1102078033
Legal Disclaimer:
MENAFN provides the information “as is” without warranty of any kind. We do not accept any responsibility or liability for the accuracy, content, images, videos, licenses, completeness, legality, or reliability of the information contained in this article. If you have any complaints or copyright issues related to this article, kindly contact the provider above.