(MENAFN- DailyFX) Copper PriceForecast
Copper chart and analysis. Copper's price rebounded from its highest level in six weeks.
Did you check our latest forecasts onUSDand Gold? Find out more for free from ourQ3 forecasts for commodities and main currencies
Copper Price –The Buyer's Indecision
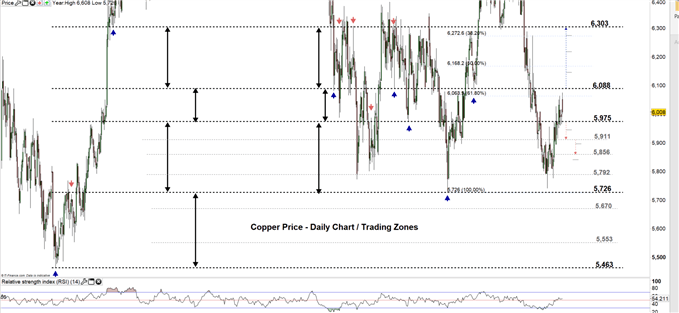
On June 26, Copper rebounded from 61.8% Fib retracement at $6,064keeping the upward trend on hold . On the following days the price closed with two Doji patterns in a raw indicating to the buyer's indecision to rally the price further.
The Relative Strength index on June 20 crossed above 50 but remained flat after, reflecting the lack of impulse to push the price higher. Its worth noting that if the oscillator dips below 50 this means a possible start for a bearish momentum.
Having trouble with your trading strategy?Here's the #1 Mistake That Traders Make
Copper DAILY PRICE CHART (FEB 10, 2017 – JUL 1, 2019) Zoomed out

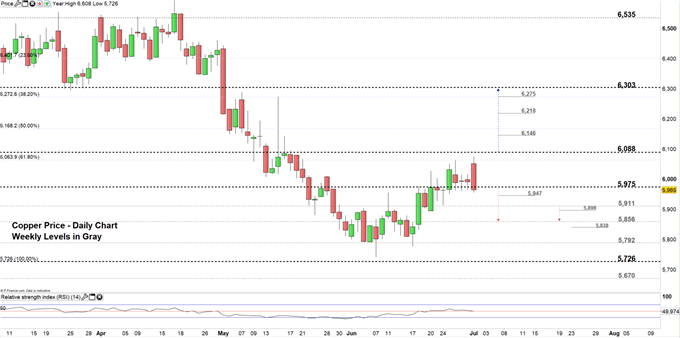
Copper DAILY PRICE CHART (Mar 12, 2019 – JUL 1, 2019) Zoomed In

Looking at the daily chart we notice today Copper opened with an upward gap at $6,052 then rallied to its highest levels in six weeks at $6,075, however; slipped back below the $6,000 handle after.
Hence, a close below $5,975 may lead the price towards $5,911. A Further close below this level, could send the price even lower towards $5,856. Although, the weekly support levels highlighted on the chart need to be considered.
In turn, a failure to close below $5,975 may cause the price to rally towards $6,088. Nonetheless, the daily resistance level at $6,017 needs to be monitored. See the chart to find out more about the key levels if the price closes above $6,088.
Just getting started?See our Beginners' Guide for FX traders
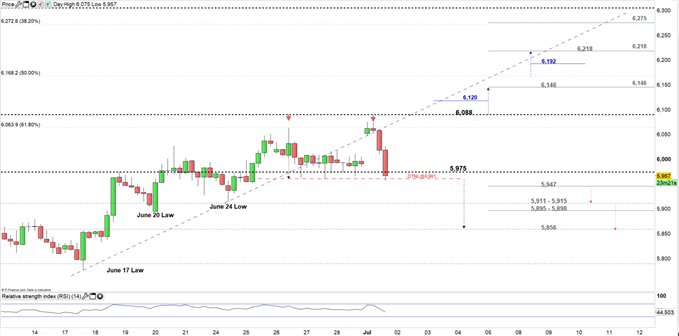
CoPper Four-HOUR PRICE CHART (Jun 13, 2019- JUL 1, 2019)

Looking at the four-hour chart, we notice on June 27 Copper corrected lower after creating a lower low at $5,961. It's worth noting that today the price broke below the uptrend line originated from the June 17 low at $5,777 then tested the neckline of the double top pattern resided at the June 27 low.
If the Copper remains below the neckline, this suggest the price might trade towards $5,856, although the weekly support levels and zones underlined on the chart should be watched along the way.
On the flip-side, a break above $6,088 may cause the price to rally towards $6,146. However, the daily resistance level marked on the chart needs to be considered. See the chart for more details if the rally continues above mentioned levels.
Written By:Mahmoud Alkudsi
Please feel free to contact me on Twitter: @Malkud
MENAFN0107201900760000ID1098710066
Legal Disclaimer:
MENAFN provides the information “as is” without warranty of any kind. We do not accept any responsibility or liability for the accuracy, content, images, videos, licenses, completeness, legality, or reliability of the information contained in this article. If you have any complaints or copyright issues related to this article, kindly contact the provider above.