(MENAFN- DailyFX)
CRUDE OIL & GOLD TALKING POINTS: Crude oil pricesidle as risk trends digest Friday's bloodlettingGold pricesroar higher amid building US rate cut speculation Commodities may fall as Fed Chair Powell strikes neutral tone Crude oil prices drifted sideways alongside the bellwetherS & P 500stock index Monday, speaking to consolidation afterFriday's brutal bloodletting . Gold prices continued to soar on the back of building Fed rate cut speculation, spurred on aftermanufacturing ISM data disappointedrelative forecasts (asexpected ).
CRUDE OIL, GOLD MAY FALL AS FED CHAIR POWELL COOLS RATE CUT BETS Looking ahead, another helping of US economic activity data may inform monetary policy bets. Factory and durable goods orders figures are on tap and may disappoint even relative to already downbeat expectations if the trend in recent news-flow holds up.
While such outcomes might have prolonged the dovish shift in Fed policy bets, they might be overshadowed by a speech form central bank Chair Jerome Powell. He has forcefully argued in favor of a wait-and-see approach in recent weeks, meaning his remarks may clash with investors' more downbeat projections.
Such rhetoric might spook investors pining for a looser monetary backdrop amid slowing global growth, escalating trade wars, and ample political uncertainty. This bodes ill for sentiment-linked crude oil prices. Gold may retreat as well as theUS Dollarperks up, cooling anti-fiat demand.
Did we get it right with our crude oil and gold forecasts?Get them hereto find out!
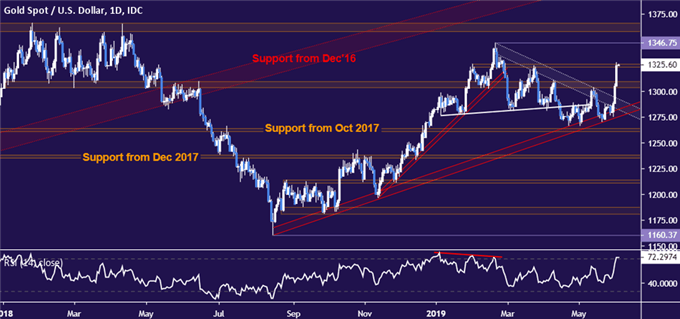
GOLD TECHNICAL ANALYSIS Gold prices continue to surge, with buyers now testing resistance in the 1323.40-26.30 area. A daily close above that exposes the late-February swing top at 1346.75. Alternatively, a move back below the 1303.70-09.12 inflection region targets rising trend line support at 1275.63.
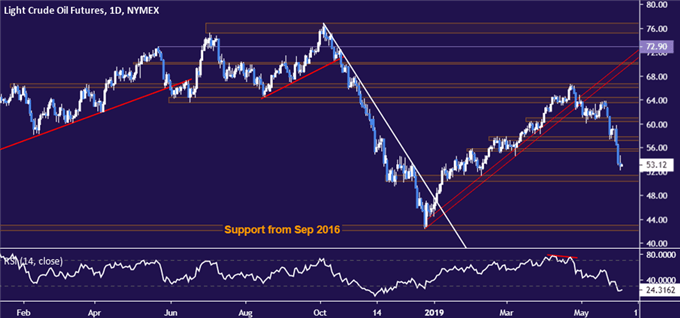
 CRUDE OIL TECHNICAL ANALYSIS Crude oil prices are edging toward support in the 50.31-51.33 area. Breaking below that on a daily closing basis sets the stage for a decline toward support dating back to September 2016 in the 42.05-43.00 zone. Immediate resistance is at 55.75, with a turn above that eyeing the 57.24-88 region next.
COMMODITY TRADING RESOURCESSee our guide to learn about thelong-term forces driving crude oil prices Having trouble with your strategy? Here's the#1 mistake that traders make Join a free webinarand have your commodity market questions answered --- Written by Ilya Spivak, Currency Strategist for DailyFX.com
To contact Ilya, use the comments section below or@IlyaSpivakon Twitter
DailyFX
MENAFN0406201900760000ID1098606259
Legal Disclaimer:
MENAFN provides the information “as is” without warranty of any kind. We do not accept any responsibility or liability for the accuracy, content, images, videos, licenses, completeness, legality, or reliability of the information contained in this article. If you have any complaints or copyright issues related to this article, kindly contact the provider above.