


403
Sorry!!
Error! We're sorry, but the page you were looking for doesn't exist.

Nine Million Older Adults Are Not Getting Benefits They Are Eligible For
(MENAFN- PR Newswire)
Nationally, only 30-49% of eligible older adults are enrolled in SNAP, SSI, and Medicare Savings Programs
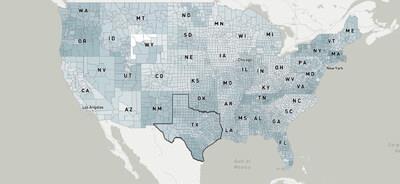
Benefits Participation Map
View in browser
Key takeaways
-
New interactive map shows benefit enrollment rates among older adults at the national, state, and local level.
Data indicates that nine million people age 65+ are eligible for but not enrolled in these programs that can help them pay for food, health care, and other daily costs.
State participation rates vary from 17% to 82%, and there is wide variation among counties.
ARLINGTON,
Va., Aug. 13, 2024 /PRNewswire/ -- A new interactive map launched today by the National Council on Aging
(NCOA) shows that, nationally, nine million adults age 65 and over with limited incomes are eligible for but not enrolled in programs that can help them afford food, Medicare, and other daily expenses.
"It's shocking and unacceptable to have nine million eligible older adults not enrolled in benefits." --Ramsey Alwin
Post thisBenefits Participation Map
Developed with the Urban Institute, the Benefits Participation Map provides national, state, and sub-state level estimates of participation rates for adults 65 and older for three benefits programs: Supplemental Nutrition Assistance Program (SNAP, monthly support for food), Supplemental Security Income (SSI, monthly cash aid), and Medicare Savings Programs (MSPs, help for Medicare premiums, deductibles, and co-insurance).
Key national findings:
-
SNAP:
Almost 9 million older adults are eligible for but not enrolled; only 30% of eligible older adults are enrolled SSI:
More than 2.3 million older adults are eligible for but not enrolled; 49% are enrolled MSP: Almost 5.8 million older adults are eligible for but not enrolled; 46% are enrolled
"It's shocking and unacceptable to have nine million eligible older adults not enrolled in benefits that can make the difference between them affording food or health care each month," said Ramsey Alwin , NCOA President and CEO. "These individuals are struggling to afford basic necessities, and they are missing out on critical assistance. NCOA is committed to using this data to strengthen our efforts to enroll more eligible older adults into benefits programs."
The Benefits Participation Map is designed to help states and community-based organizations identify where to focus their enrollment efforts for the greatest impact. It was made possible with funding from the U.S. Administration for Community Living (ACL). NCOA provides funding and technical assistance to around 100 local agencies that are conducting benefits outreach and enrollment in communities across the country. Many target hard-to-reach populations, including those living in rural areas and people of color.
Key state findings:
-
For SNAP, participation rates range from a low of 17% in California and Iowa to high of 51% in Rhode Island-the only state to break 50% for SNAP.
For
SSI, participation rates range from a low of 21% in North Dakota and New Hampshire to 82% in Alaska. Several states with large populations of eligible individuals who are not enrolled were among those with the highest participation rates. For example, while California has a 59% participation rate in SSI, there are still over 400,000 individuals who are not enrolled, and New York, which has a 65% participation rate, has 120,000 individuals who are not enrolled. For
MSP, participation rates range from a low of 21% in North Dakota to 67% in Washington. Massachusetts, New York, Alaska, Washington, and Florida have participation rates within the top quarter of all states and the District of Columbia for all programs. North Dakota, Wyoming, and Montana have participation rates in the bottom quarter of states and the District of Columbia for all programs.
Wide variations among counties and multi-county groups
Wide variation among counties and multi-county groups can be found in both states with low and high participation rates. For example, California's estimated SNAP participation rate is 17%, but the sub-state rates range from a low of 9% in Placer and San Mateo counties to a high of 27% in Tulare County. Washington has a high MSP participation rate of 67%, but it ranges from a low of 39% in the multi-county group composed of Island, San Juan, and Skagit counties to a high of 92% in Clark County.
Florida's estimated participation rate for SSI is 49%, the same as the national estimated rate. Yet within Florida, the rates vary from 15% in Hernando County to 90% in Miami-Dade. As one of the largest counties in the U.S., Miami-Dade's high participation rate pushes the state's estimated rate higher such that, of the 23 counties and multi-county groups in Florida, all but two (Miami-Dade and Hillsborough) have estimated rates below the state rate.
How to use the map
Users can search for up to 5 counties and states by name or ZIP code. Users can see participation rates for SNAP, SSI, or MSP in the selected area and how they compare to national and state rates. Users can also download the data in Excel, .csv, or .pdf format. Urban Institute calculated the estimates and developed the map under contract for NCOA.
Where data is not available at the county level, an estimate is used for a multi-county group. Users can view borders around multi-county areas or show borders for states and individual counties only.
About NCOA
The National Council on Aging (NCOA) is the national voice for every person's right to age well. We believe that how we age should not be determined by gender, color, sexuality, income, or ZIP code. Working with thousands of national and local partners, we provide resources, tools, best practices, and advocacy to ensure every person can age with health and financial security. Founded in 1950, we are the oldest national organization focused on older adults. Learn more at and @NCOAging .
SOURCE National Council on Aging

Legal Disclaimer:
MENAFN provides the
information “as is” without warranty of any kind. We do not accept
any responsibility or liability for the accuracy, content, images,
videos, licenses, completeness, legality, or reliability of the information
contained in this article. If you have any complaints or copyright
issues related to this article, kindly contact the provider above.
Most popular stories
Market Research

More Story


Comments
No comment