


403
Sorry!!
Error! We're sorry, but the page you were looking for doesn't exist.
Trupanion Reports Second Quarter 2024 Results
| Trupanion, Inc. Condensed Consolidated Statements of Operations (in thousands, except share data) | |||||||||||||||
| Three Months Ended June 30, | Six Months Ended June 30, | ||||||||||||||
| 2024 | 2023 | 2024 | 2023 | ||||||||||||
| (unaudited) | |||||||||||||||
| Revenue: | |||||||||||||||
| Subscription business | $ | 208,618 | $ | 173,253 | $ | 409,752 | $ | 338,463 | |||||||
| Other business | 106,182 | 97,313 | 211,169 | 188,432 | |||||||||||
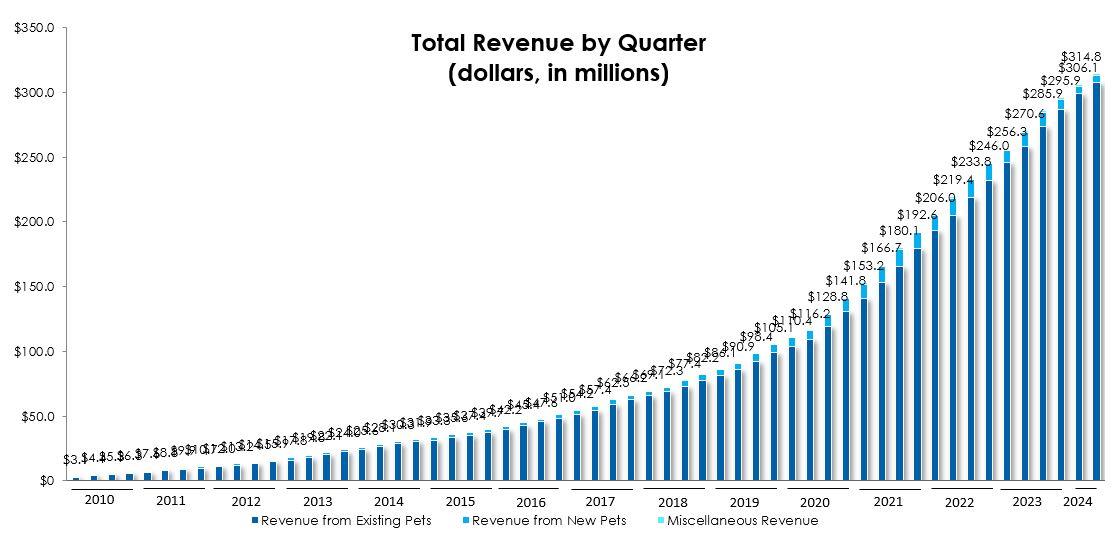
| Total revenue | 314,800 | 270,566 | 620,921 | 526,895 | |||||||||||
| Cost of revenue: | |||||||||||||||
| Subscription business(1) | 175,740 | 151,520 | 347,871 | 297,611 | |||||||||||
| Other business | 98,791 | 89,673 | 196,554 | 173,565 | |||||||||||
| Total cost of revenue(2) | 274,531 | 241,193 | 544,425 | 471,176 | |||||||||||
| Operating expenses: | |||||||||||||||
| Technology and development(1) | 8,190 | 5,232 | 15,150 | 10,132 | |||||||||||
| General and administrative(1) | 15,253 | 13,136 | 29,926 | 34,153 | |||||||||||
| New pet acquisition expense(1) | 17,874 | 20,769 | 34,717 | 42,411 | |||||||||||
| Depreciation and amortization | 4,376 | 3,253 | 8,161 | 6,455 | |||||||||||
| Total operating expenses | 45,693 | 42,390 | 87,954 | 93,151 | |||||||||||
| Loss from investment in joint venture | (47 | ) | (73 | ) | (150 | ) | (144 | ) | |||||||
| Operating loss | (5,471 | ) | (13,090 | ) | (11,608 | ) | (37,576 | ) | |||||||
| Interest expense | 3,655 | 2,940 | 7,251 | 5,327 | |||||||||||
| Other income, net | (3,220 | ) | (2,078 | ) | (6,063 | ) | (3,980 | ) | |||||||
| Loss before income taxes | (5,906 | ) | (13,952 | ) | (12,796 | ) | (38,923 | ) | |||||||
| Income tax benefit | (44 | ) | (238 | ) | (82 | ) | (429 | ) | |||||||
| Net loss | $ | (5,862 | ) | $ | (13,714 | ) | $ | (12,714 | ) | $ | (38,494 | ) | |||
| Net loss per share: | |||||||||||||||
| Basic and diluted | $ | (0.14 | ) | $ | (0.33 | ) | $ | (0.30 | ) | $ | (0.93 | ) | |||
| Weighted average shares of common stock outstanding: | |||||||||||||||
| Basic and diluted | 42,078,271 | 41,383,411 | 41,997,683 | 41,246,411 | |||||||||||
| (1)Includes stock-based compensation expense as follows: | Three Months Ended June 30, | Six Months Ended June 30, | |||||||||||||
| 2024 | 2023 | 2024 | 2023 | ||||||||||||
| Cost of revenue | $ | 1,395 | $ | 1,307 | $ | 2,785 | $ | 2,625 | |||||||
| Technology and development | 1,261 | 627 | 2,515 | 1,335 | |||||||||||
| General and administrative | 3,861 | 2,948 | 7,310 | 11,167 | |||||||||||
| New pet acquisition expense | 2,129 | 1,755 | 4,188 | 3,841 | |||||||||||
| Total stock-based compensation expense | $ | 8,646 | $ | 6,637 | $ | 16,798 | $ | 18,968 | |||||||
| (2)The breakout of cost of revenue between veterinary invoice expense and other cost of revenue is as follows: | |||||||||||||||
| Three Months Ended June 30, | Six Months Ended June 30, | ||||||||||||||
| 2024 | 2023 | 2024 | 2023 | ||||||||||||
| Veterinary invoice expense | $ | 231,102 | $ | 206,738 | $ | 464,671 | $ | 400,875 | |||||||
| Other cost of revenue | 43,429 | 34,455 | 79,754 | 70,301 | |||||||||||
| Total cost of revenue | $ | 274,531 | $ | 241,193 | $ | 544,425 | $ | 471,176 |
| Trupanion, Inc. Condensed Consolidated Balance Sheets (in thousands, except share data) | |||||||
| June 30, 2024 | December 31, 2023 | ||||||
| (unaudited) | |||||||
| Assets | |||||||
| Current assets: | |||||||
| Cash and cash equivalents | $ | 124,343 | $ | 147,501 | |||
| Short-term investments | 152,870 | 129,667 | |||||
| Accounts and other receivables, net of allowance for credit loss of $1,019 at June 30, 2024 and $1,085 at December 31, 2023 | 285,944 | 267,899 | |||||
| Prepaid expenses and other assets | 15,703 | 17,022 | |||||
| Total current assets | 578,860 | 562,089 | |||||
| Restricted cash | 23,250 | 22,963 | |||||
| Long-term investments | 14,119 | 12,866 | |||||
| Property, equipment and internal-use software, net | 104,022 | 103,650 | |||||
| Intangible assets, net | 15,930 | 18,745 | |||||
| Other long-term assets | 16,737 | 18,922 | |||||
| Goodwill | 43,028 | 43,713 | |||||
| Total assets | $ | 795,946 | $ | 782,948 | |||
| Liabilities and stockholders' equity | |||||||
| Current liabilities: | |||||||
| Accounts payable | $ | 6,630 | $ | 10,505 | |||
| Accrued liabilities and other current liabilities | 34,668 | 34,052 | |||||
| Reserve for veterinary invoices | 60,574 | 63,238 | |||||
| Deferred revenue | 252,583 | 235,329 | |||||
| Long-term debt - current portion | 1,350 | 1,350 | |||||
| Total current liabilities | 355,805 | 344,474 | |||||
| Long-term debt | 127,559 | 127,580 | |||||
| Deferred tax liabilities | 2,239 | 2,685 | |||||
| Other liabilities | 4,495 | 4,487 | |||||
| Total liabilities | 490,098 | 479,226 | |||||
| Stockholders' equity: | |||||||
| Common stock: $0.00001 par value per share, 100,000,000 shares authorized; 43,187,817 and 42,159,631 issued and outstanding at June 30, 2024; 42,887,052 and 41,858,866 shares issued and outstanding at December 31, 2023 | - | - | |||||
| Preferred stock: $0.00001 par value per share, 10,000,000 shares authorized; no shares issued and outstanding | - | - | |||||
| Additional paid-in capital | 553,122 | 536,108 | |||||
| Accumulated other comprehensive loss | (1,771 | ) | 403 | ||||
| Accumulated deficit | (228,969 | ) | (216,255 | ) | |||
| Treasury stock, at cost: 1,028,186 shares at June 30, 2024 and December 31, 2023 | (16,534 | ) | (16,534 | ) | |||
| Total stockholders' equity | 305,848 | 303,722 | |||||
| Total liabilities and stockholders' equity | $ | 795,946 | $ | 782,948 |
| Trupanion, Inc. Condensed Consolidated Statements of Cash Flows (in thousands) | |||||||||||||||
| Three Months Ended June 30, | Six Months Ended June 30, | ||||||||||||||
| 2024 | 2023 | 2024 | 2023 | ||||||||||||
| (unaudited) | |||||||||||||||
| Operating activities | |||||||||||||||
| Net loss | $ | (5,862 | ) | $ | (13,714 | ) | $ | (12,714 | ) | $ | (38,494 | ) | |||
| Adjustments to reconcile net loss to cash provided by (used in) operating activities: | |||||||||||||||
| Depreciation and amortization | 4,376 | 3,253 | 8,161 | 6,455 | |||||||||||
| Stock-based compensation expense | 8,646 | 6,637 | 16,798 | 18,968 | |||||||||||
| Other, net | (116 | ) | (188 | ) | (318 | ) | (585 | ) | |||||||
| Changes in operating assets and liabilities: | |||||||||||||||
| Accounts and other receivables | (7,508 | ) | (17,337 | ) | (18,226 | ) | (33,184 | ) | |||||||
| Prepaid expenses and other assets | 2,010 | 552 | 2,297 | (3,213 | ) | ||||||||||
| Accounts payable, accrued liabilities, and other liabilities | 3,404 | (1,316 | ) | (1,727 | ) | (6,464 | ) | ||||||||
| Reserve for veterinary invoices | (1,650 | ) | 7,833 | (2,535 | ) | 12,439 | |||||||||
| Deferred revenue | 3,555 | 10,875 | 17,554 | 33,811 | |||||||||||
| Net cash provided by (used in) operating activities | 6,855 | (3,405 | ) | 9,290 | (10,267 | ) | |||||||||
| Investing activities | |||||||||||||||
| Purchases of investment securities | (62,056 | ) | (45,136 | ) | (81,249 | ) | (79,931 | ) | |||||||
| Maturities and sales of investment securities | 36,673 | 43,859 | 55,678 | 117,652 | |||||||||||
| Purchases of property, equipment, and internal-use software | (2,880 | ) | (4,735 | ) | (5,945 | ) | (9,919 | ) | |||||||
| Other | 546 | 483 | 1,062 | 583 | |||||||||||
| Net cash provided by (used in) investing activities | (27,717 | ) | (5,529 | ) | (30,454 | ) | 28,385 | ||||||||
| Financing activities | |||||||||||||||
| Proceeds from debt financing, net of financing fees | - | - | - | 35,130 | |||||||||||
| Proceeds from exercise of stock options | 99 | 513 | 471 | 653 | |||||||||||
| Shares withheld to satisfy tax withholding | (343 | ) | (171 | ) | (588 | ) | (1,024 | ) | |||||||
| Repayments of debt financing | (337 | ) | (435 | ) | (675 | ) | (1,042 | ) | |||||||
| Other | (377 | ) | - | (452 | ) | - | |||||||||
| Net cash provided by (used in) financing activities | (958 | ) | (93 | ) | (1,244 | ) | 33,717 | ||||||||
| Effect of foreign exchange rate changes on cash, cash equivalents, and restricted cash, net | (150 | ) | (184 | ) | (463 | ) | 76 | ||||||||
| Net change in cash, cash equivalents, and restricted cash | (21,969 | ) | (9,211 | ) | (22,871 | ) | 51,911 | ||||||||
| Cash, cash equivalents, and restricted cash at beginning of period | 169,562 | 145,759 | 170,464 | 84,637 | |||||||||||
| Cash, cash equivalents, and restricted cash at end of period | $ | 147,593 | $ | 136,548 | $ | 147,593 | $ | 136,548 |
| The following tables set forth our key operating metrics. | |||||||||||||||||||||||||||||||
| Six Months Ended June 30, | |||||||||||||||||||||||||||||||
| 2024 | 2023 | ||||||||||||||||||||||||||||||
| Total Business: | |||||||||||||||||||||||||||||||
| Total pets enrolled (at period end) | 1,699,643 | 1,679,659 | |||||||||||||||||||||||||||||
| Subscription Business: | |||||||||||||||||||||||||||||||
| Total subscription pets enrolled (at period end) | 1,020,934 | 943,958 | |||||||||||||||||||||||||||||
| Monthly average revenue per pet | $ | 70.76 | $ | 64.00 | |||||||||||||||||||||||||||
| Lifetime value of a pet, including fixed expenses | $ | 450 | $ | 470 | |||||||||||||||||||||||||||
| Average pet acquisition cost (PAC) | $ | 219 | $ | 241 | |||||||||||||||||||||||||||
| Average monthly retention | 98.34 | % | 98.61 | % | |||||||||||||||||||||||||||
| Three Months Ended | |||||||||||||||||||||||||||||||
| Jun. 30, 2024 | Mar. 31, 2024 | Dec. 31, 2023 | Sep. 30, 2023 | Jun. 30, 2023 | Mar. 31, 2023 | Dec. 31, 2022 | Sep. 30, 2022 | ||||||||||||||||||||||||
| Total Business: | |||||||||||||||||||||||||||||||
| Total pets enrolled (at period end) | 1,699,643 | 1,708,017 | 1,714,473 | 1,712,177 | 1,679,659 | 1,616,865 | 1,537,573 | 1,439,605 | |||||||||||||||||||||||
| Subscription Business: | |||||||||||||||||||||||||||||||
| Total subscription pets enrolled (at period end) | 1,020,934 | 1,006,168 | 991,426 | 969,322 | 943,958 | 906,369 | 869,862 | 808,077 | |||||||||||||||||||||||
| Monthly average revenue per pet | $ | 71.72 | $ | 69.79 | $ | 67.07 | $ | 65.82 | $ | 64.41 | $ | 63.58 | $ | 63.11 | $ | 63.80 | |||||||||||||||
| Lifetime value of a pet, including fixed expenses | $ | 450 | $ | 428 | $ | 419 | $ | 428 | $ | 470 | $ | 541 | $ | 641 | $ | 673 | |||||||||||||||
| Average pet acquisition cost (PAC) | $ | 231 | $ | 207 | $ | 217 | $ | 212 | $ | 236 | $ | 247 | $ | 283 | $ | 268 | |||||||||||||||
| Average monthly retention | 98.34 | % | 98.41 | % | 98.49 | % | 98.55 | % | 98.61 | % | 98.65 | % | 98.69 | % | 98.71 | % |
| The following table reflects the reconciliation of cash provided by operating activities to free cash flow (in thousands): | |||||||||||||||
| Three Months Ended June 30, | Six Months Ended June 30, | ||||||||||||||
| 2024 | 2023 | 2024 | 2023 | ||||||||||||
| Net cash provided by (used in) operating activities | $ | 6,855 | $ | (3,405 | ) | $ | 9,290 | $ | (10,267 | ) | |||||
| Purchases of property, equipment, and internal-use software | (2,880 | ) | (4,735 | ) | (5,945 | ) | (9,919 | ) | |||||||
| Free cash flow | $ | 3,975 | $ | (8,140 | ) | $ | 3,345 | $ | (20,186 | ) |
| The following tables reflect the reconciliation between GAAP and non-GAAP measures (in thousands except percentages): | ||||||||||||||||
| Three months ended June 30, | Six Months Ended June 30, | |||||||||||||||
| 2024 | 2023 | 2024 | 2023 | |||||||||||||
| Veterinary invoice expense | $ | 231,102 | $ | 206,738 | $ | 464,671 | $ | 400,875 | ||||||||
| Less: | ||||||||||||||||
| Stock-based compensation expense(1) | (843 | ) | (856 | ) | (1,705 | ) | (1,695 | ) | ||||||||
| Other business cost of paying veterinary invoices(4) | (75,622 | ) | (72,443 | ) | (156,836 | ) | (137,592 | ) | ||||||||
| Subscription cost of paying veterinary invoices (non-GAAP) | $ | 154,637 | $ | 133,439 | $ | 306,130 | $ | 261,588 | ||||||||
| % of subscription revenue | 74.1 | % | 77.0 | % | 74.7 | % | 77.3 | % | ||||||||
| Other cost of revenue | $ | 43,429 | $ | 34,455 | $ | 79,754 | $ | 70,301 | ||||||||
| Less: | ||||||||||||||||
| Stock-based compensation expense(1) | (523 | ) | (428 | ) | (943 | ) | (876 | ) | ||||||||
| Other business variable expenses(4) | (23,091 | ) | (17,230 | ) | (39,589 | ) | (35,973 | ) | ||||||||
| Subscription variable expenses (non-GAAP) | $ | 19,815 | $ | 16,797 | $ | 39,222 | $ | 33,452 | ||||||||
| % of subscription revenue | 9.5 | % | 9.7 | % | 9.6 | % | 9.9 | % | ||||||||
| Technology and development expense | $ | 8,190 | $ | 5,232 | $ | 15,150 | $ | 10,132 | ||||||||
| General and administrative expense | 15,253 | 13,136 | 29,926 | 34,153 | ||||||||||||
| Less: | ||||||||||||||||
| Stock-based compensation expense(1) | (4,949 | ) | (3,497 | ) | (9,208 | ) | (12,318 | ) | ||||||||
| Non-recurring transaction or restructuring expenses(2) | - | (65 | ) | - | (4,167 | ) | ||||||||||
| Development expenses(3) | (1,655 | ) | (925 | ) | (2,832 | ) | (1,823 | ) | ||||||||
| Fixed expenses (non-GAAP) | $ | 16,839 | $ | 13,881 | $ | 33,036 | $ | 25,977 | ||||||||
| % of total revenue | 5.3 | % | 5.1 | % | 5.3 | % | 4.9 | % | ||||||||
| New pet acquisition expense | $ | 17,874 | $ | 20,769 | $ | 34,717 | $ | 42,411 | ||||||||
| Less: | ||||||||||||||||
| Stock-based compensation expense(1) | (2,066 | ) | (1,722 | ) | (3,923 | ) | (3,754 | ) | ||||||||
| Other business pet acquisition expense(4) | (10 | ) | (62 | ) | (23 | ) | (113 | ) | ||||||||
| Subscription acquisition cost (non-GAAP) | $ | 15,798 | $ | 18,985 | $ | 30,771 | $ | 38,544 | ||||||||
| % of subscription revenue | 7.6 | % | 11.0 | % | 7.5 | % | 11.4 | % | ||||||||
| (1) Trupanion employees may elect to take restricted stock units in lieu of cash payment for their bonuses. We account for such expense as stock-based compensation according to GAAP, but we do not include it in any non-GAAP adjustments. Stock-based compensation associated with bonuses was approximately $0.3 million and $1.1 million for the three and six months ended June 30, 2024, respectively. (2) Consists of business acquisition transaction expenses, severance and legal costs due to certain executive departures, and a $3.8 million non-recurring settlement of accounts receivable in the first quarter of 2023 related to uncollected premiums in connection with the transition of underwriting a third-party business to other insurers. (3) Consists of costs related to product exploration and development that are pre-revenue and historically have been insignificant. (4) Excludes the portion of stock-based compensation expense attributable to the other business segment |
| The following tables reflect the reconciliation of GAAP measures to non-GAAP measures (in thousands, except percentages): | |||||||||||||||
| Three Months Ended June 30, | Six Months Ended June 30, | ||||||||||||||
| 2024 | 2023 | 2024 | 2023 | ||||||||||||
| Subscription revenue | $ | 208,618 | $ | 173,253 | $ | 409,752 | $ | 338,463 | |||||||
| Subscription cost of paying veterinary invoices | 154,637 | 133,439 | 306,130 | 261,588 | |||||||||||
| Subscription variable expenses | 19,815 | 16,797 | 39,222 | 33,452 | |||||||||||
| Subscription fixed expenses* | 11,160 | 8,890 | 21,800 | 16,685 | |||||||||||
| Subscription adjusted operating income (non-GAAP) | $ | 23,006 | $ | 14,127 | $ | 42,600 | $ | 26,738 | |||||||
| Other business revenue | $ | 106,182 | 97,313 | $ | 211,169 | $ | 188,432 | ||||||||
| Other business cost of paying veterinary invoices | 75,622 | 72,443 | 156,836 | 137,592 | |||||||||||
| Other business variable expenses | 23,090 | 17,229 | 39,588 | 35,973 | |||||||||||
| Other business fixed expenses* | 5,679 | 4,991 | 11,236 | 9,292 | |||||||||||
| Other business adjusted operating income (non-GAAP) | $ | 1,791 | $ | 2,650 | $ | 3,509 | $ | 5,575 | |||||||
| Revenue | $ | 314,800 | $ | 270,566 | $ | 620,921 | $ | 526,895 | |||||||
| Cost of paying veterinary invoices | 230,259 | 205,882 | 462,966 | 399,180 | |||||||||||
| Variable expenses | 42,905 | 34,026 | 78,810 | 69,425 | |||||||||||
| Fixed expenses* | 16,839 | 13,881 | 33,036 | 25,977 | |||||||||||
| Total business adjusted operating income (non-GAAP) | $ | 24,797 | $ | 16,777 | $ | 46,109 | $ | 32,313 | |||||||
| As a percentage of revenue: | Three Months Ended June 30, | Six Months Ended June 30, | |||||||||||||
| 2024 | 2023 | 2024 | 2023 | ||||||||||||
| Subscription revenue | 100.0 | % | 100.0 | % | 100.0 | % | 100.0 | % | |||||||
| Subscription cost of paying veterinary invoices | 74.1 | % | 77.0 | % | 74.7 | % | 77.3 | % | |||||||
| Subscription variable expenses | 9.5 | % | 9.7 | % | 9.6 | % | 9.9 | % | |||||||
| Subscription fixed expenses* | 5.3 | % | 5.1 | % | 5.3 | % | 4.9 | % | |||||||
| Subscription adjusted operating income (non-GAAP) | 11.0 | % | 8.2 | % | 10.4 | % | 7.9 | % | |||||||
| Other business revenue | 100.0 | % | 100.0 | % | 100.0 | % | 100.0 | % | |||||||
| Other business cost of paying veterinary invoices | 71.2 | % | 74.4 | % | 74.3 | % | 73.0 | % | |||||||
| Other business variable expenses | 21.7 | % | 17.7 | % | 18.7 | % | 19.1 | % | |||||||
| Other business fixed expenses* | 5.3 | % | 5.1 | % | 5.3 | % | 4.9 | % | |||||||
| Other business adjusted operating income (non-GAAP) | 1.7 | % | 2.7 | % | 1.7 | % | 3.0 | % | |||||||
| Revenue | 100.0 | % | 100.0 | % | 100.0 | % | 100.0 | % | |||||||
| Cost of paying veterinary invoices | 73.1 | % | 76.1 | % | 74.6 | % | 75.8 | % | |||||||
| Variable expenses | 13.6 | % | 12.6 | % | 12.7 | % | 13.2 | % | |||||||
| Fixed expenses* | 5.3 | % | 5.1 | % | 5.3 | % | 4.9 | % | |||||||
| Total business adjusted operating income (non-GAAP) | 7.9 | % | 6.2 | % | 7.4 | % | 6.1 | % | |||||||
| *Fixed expenses represent shared services that support both our subscription and other business segments and, as such, are generally allocated to each segment pro-rata based on revenues. |
| The following tables reflect the reconciliation of GAAP measures to non-GAAP measures (in thousands, except percentages): | |||||||||||||||
| Three Months Ended June 30, | Six Months Ended June 30, | ||||||||||||||
| 2024 | 2023 | 2024 | 2023 | ||||||||||||
| Operating Loss | $ | (5,471 | ) | $ | (13,090 | ) | $ | (11,608 | ) | $ | (37,576 | ) | |||
| Non-GAAP expense adjustments | |||||||||||||||
| Acquisition cost | 15,808 | 19,047 | 30,793 | 38,657 | |||||||||||
| Stock-based compensation expense(1) | 8,381 | 6,504 | 15,780 | 18,643 | |||||||||||
| Development expenses(3) | 1,656 | 925 | 2,833 | 1,823 | |||||||||||
| Depreciation and amortization | 4,376 | 3,253 | 8,161 | 6,455 | |||||||||||
| Non-recurring transaction or restructuring expenses(2) | - | 65 | - | 4,167 | |||||||||||
| Gain (loss) from investment in joint venture | (47 | ) | (73 | ) | (150 | ) | (144 | ) | |||||||
| Total adjusted operating income (non-GAAP) | $ | 24,797 | $ | 16,777 | $ | 46,109 | $ | 32,313 | |||||||
| Subscription Business: | |||||||||||||||
| Subscription operating loss | $ | (3,420 | ) | $ | (12,818 | ) | $ | (7,939 | ) | $ | (31,585 | ) | |||
| Non-GAAP expense adjustments | |||||||||||||||
| Acquisition cost | 15,798 | 18,985 | 30,771 | 38,544 | |||||||||||
| Stock-based compensation expense(1) | 6,631 | 5,246 | 12,512 | 14,237 | |||||||||||
| Development expenses(3) | 1,097 | 590 | 1,871 | 1,171 | |||||||||||
| Depreciation and amortization | 2,900 | 2,083 | 5,385 | 4,147 | |||||||||||
| Non-recurring transaction or restructuring expenses(2) | - | 41 | - | 224 | |||||||||||
| Subscription adjusted operating income (non-GAAP) | $ | 23,006 | $ | 14,127 | $ | 42,600 | $ | 26,738 | |||||||
| Other Business: | |||||||||||||||
| Other business operating loss | $ | (2,004 | ) | $ | (199 | ) | $ | (3,519 | ) | $ | (5,847 | ) | |||
| Non-GAAP expense adjustments | |||||||||||||||
| Acquisition cost | 10 | 62 | 22 | 113 | |||||||||||
| Stock-based compensation expense(1) | 1,750 | 1,258 | 3,268 | 4,406 | |||||||||||
| Development expenses(3) | 559 | 335 | 962 | 652 | |||||||||||
| Depreciation and amortization | 1,476 | 1,170 | 2,776 | 2,308 | |||||||||||
| Non-recurring transaction or restructuring expenses(2) | - | 24 | - | 3,943 | |||||||||||
| Other business adjusted operating income (non-GAAP) | $ | 1,790 | $ | 2,647 | $ | 3,510 | $ | 5,575 | |||||||
| (1) Trupanion employees may elect to take restricted stock units in lieu of cash payment for their bonuses. We account for such expense as stock-based compensation in accordance with GAAP, but we do not include it in any non-GAAP adjustments. Stock-based compensation associated with bonuses was approximately $0.3 million and $1.1 million for the three and six months ended June 30, 2024, respectively. | |||||||||||||||
| (2) Consists of business acquisition transaction expenses, severance and legal costs due to certain executive departures, and a $3.8 million non-recurring settlement of accounts receivable in the first quarter of 2023 related to uncollected premiums in connection with the transition of underwriting a third-party business to other insurers. | |||||||||||||||
| (3) As we enter the next phase of our growth, we expect to invest in initiatives that are pre-revenue, including adding new products and international expansion. These development expenses are costs related to product exploration and development that are pre-revenue and historically have been insignificant. We view these activities as uses of our adjusted operating income separate from pet acquisition spend. | |||||||||||||||
Adjusted operating income is a non-GAAP financial measure that adjusts operating income (loss) to remove the effect of acquisition cost, development expenses, non-recurring transaction or restructuring expenses, and gain (loss) from investment in joint venture. Non-cash items, such as stock-based compensation expense and depreciation and amortization, are also excluded. Acquisition cost, development expenses, gain (loss) from investment in joint venture, stock-based compensation expense, and depreciation and amortization are expected to remain recurring expenses for the foreseeable future, but are excluded from this metric to measure scale in other areas of the business. Management believes acquisition costs primarily represent the cost to acquire new subscribers and are driven by the amount of growth we choose to pursue based primarily on the amount of our adjusted operating income period over period. Accordingly, this measure is not indicative of our core operating income performance. We also exclude development expenses, gain (loss) from investment in joint venture, stock-based compensation expense, and depreciation and amortization because some investors may not view those items as reflective of our core operating income performance.
Management uses adjusted operating income and the margin on adjusted operating income to understand the effects of scale in its non-acquisition cost and development expenses and to plan future advertising expenditures, which are designed to acquire new pets. Management uses this measure as a principal way of understanding the operating performance of its business exclusive of acquisition cost and new product exploration and development initiatives. Management believes disclosure of this metric provides investors with the same data that the Company employs in assessing its overall operations and that disclosure of this measure may provide useful information regarding the efficiency of our utilization of revenues, return on advertising dollars in the form of new subscribers and future use of available cash to support the continued growth of our business.
| The following tables reflect the reconciliation of adjusted EBITDA to net loss (in thousands): | |||||||||||||||||||||||||||||||
| Six Months Ended June 30, | |||||||||||||||||||||||||||||||
| 2024 | 2023 | ||||||||||||||||||||||||||||||
| Net loss | $ | (12,714 | ) | $ | (38,494 | ) | |||||||||||||||||||||||||
| Excluding: | |||||||||||||||||||||||||||||||
| Stock-based compensation expense | 15,779 | 18,643 | |||||||||||||||||||||||||||||
| Depreciation and amortization expense | 8,161 | 6,455 | |||||||||||||||||||||||||||||
| Interest income | (6,180 | ) | (3,780 | ) | |||||||||||||||||||||||||||
| Interest expense | 7,251 | 5,327 | |||||||||||||||||||||||||||||
| Income tax benefit | (82 | ) | (429 | ) | |||||||||||||||||||||||||||
| Non-recurring transaction or restructuring expenses | - | 4,167 | |||||||||||||||||||||||||||||
| Adjusted EBITDA | $ | 12,215 | $ | (8,111 | ) | ||||||||||||||||||||||||||
| Three Months Ended | |||||||||||||||||||||||||||||||
| Jun. 30, 2024 | Mar. 31, 2024 | Dec. 31, 2023 | Sep. 30, 2023 | Jun. 30, 2023 | Mar. 31, 2023 | Dec. 31, 2022 | Sep. 30, 2022 | ||||||||||||||||||||||||
| Net loss | $ | (5,862 | ) | $ | (6,852 | ) | $ | (2.163 | ) | $ | (4,036 | ) | $ | (13,714 | ) | $ | (24,780 | ) | $ | (9,285 | ) | $ | (12,914 | ) | |||||||
| Excluding: | |||||||||||||||||||||||||||||||
| Stock-based compensation expense | 8,381 | 7,398 | 6.636 | 6,585 | 6,503 | 12,140 | 8,412 | 8,306 | |||||||||||||||||||||||
| Depreciation and amortization expense | 4,376 | 3,785 | 3.029 | 2,990 | 3,253 | 3,202 | 2,897 | 2,600 | |||||||||||||||||||||||
| Interest income | (3,135 | ) | (3,045 | ) | (2.842 | ) | (2,389 | ) | (2,051 | ) | (1,729 | ) | (1,614 | ) | (1,018 | ) | |||||||||||||||
| Interest expense | 3,655 | 3,596 | 3.697 | 3,053 | 2,940 | 2,387 | 1,587 | 1,408 | |||||||||||||||||||||||
| Income tax expense (benefit) | (44 | ) | (38 | ) | 130 | (43 | ) | (238 | ) | (191 | ) | (15 | ) | 496 | |||||||||||||||||
| Non-recurring transaction or restructuring expenses | - | - | - | 8 | 65 | 4,102 | 193 | 179 | |||||||||||||||||||||||
| (Gain) loss from equity method investment | - | - | - | (110 | ) | - | - | - | - | ||||||||||||||||||||||
| Adjusted EBITDA | $ | 7,371 | $ | 4,844 | $ | 8.487 | $ | 6,058 | $ | (3,242 | ) | $ | (4,869 | ) | $ | 2,175 | $ | (943 | ) | ||||||||||||
Contacts :
Investors:
Laura Bainbridge, Senior Vice President, Corporate Communications
Gil Melchior, Director, Investor Relations
...
A photo accompanying this announcement is available at


Legal Disclaimer:
MENAFN provides the
information “as is” without warranty of any kind. We do not accept
any responsibility or liability for the accuracy, content, images,
videos, licenses, completeness, legality, or reliability of the information
contained in this article. If you have any complaints or copyright
issues related to this article, kindly contact the provider above.
Most popular stories
Market Research

More Story


Comments
No comment