(MENAFN- Daily Forex) Bullish view
Buy the BTC/USD pair and set a take-profit at 66,000. Add a stop-loss at 57,000. Timeline: 1-2 days.
Bearish view
Set a sell-stop at 59,000 and a take-profit at 57,000. Add a stop-loss at 61,000.
The remarkable
bitcoin price rally gains steam this week as buyers focused on reaching its all-time high of $69,000. The BTC/USD pair surged to the important point at 64,000, its highest point since 2021. This is a strong surge since the pair bottomed at 38,500 in January demand soars
The BTC/USD pair continued its strong comeback as demand for the coin jumped around the world. For example, in the United States, the biggest spot Bitcoin ETFs have seen some of their biggest inflows this week.
The iShares Bitcoin ETF (IBIT) has added over $3 billion in assets, bringing the total amount of assets to over $6 billion. Other funds from the likes of Fidelity, Franklin Templeton, and Ark Invest have also seen robust inflows.
Inflows in spot Bitcoin ETFs are signs of more demand since they are all backed by real coins. This is happening at a time when Bitcoin's supply is expected to fall after April's halving event. Halving is a situation where the amount of Bitcoin rewards are slashed by half, affecting supply.
Forex Brokers We Recommend in Your Region See full brokers list 1 Read full review Get Started
Bitcoin has also soared because of the Fear of Missing Out (FOMO). This is a situation where investors buy assets because they are doing well. In this case, most people are buying Bitcoin because it is in a strong bullish trend .
Further, this performance is mostly because of the positive outlook from most analysts. For example, Tom Lee, Cathie Wood, and Mike Novogratz have all argued that Bitcoin will rise to over $100,000 this year.
Bitcoin's performance shows that it has lost its overall correlation with stocks. As it jumped on Tuesday, American equities remained in the deep red. The Dow Jones and Nasdaq 100 indices retreated by more than 100 points/USD technical analysis
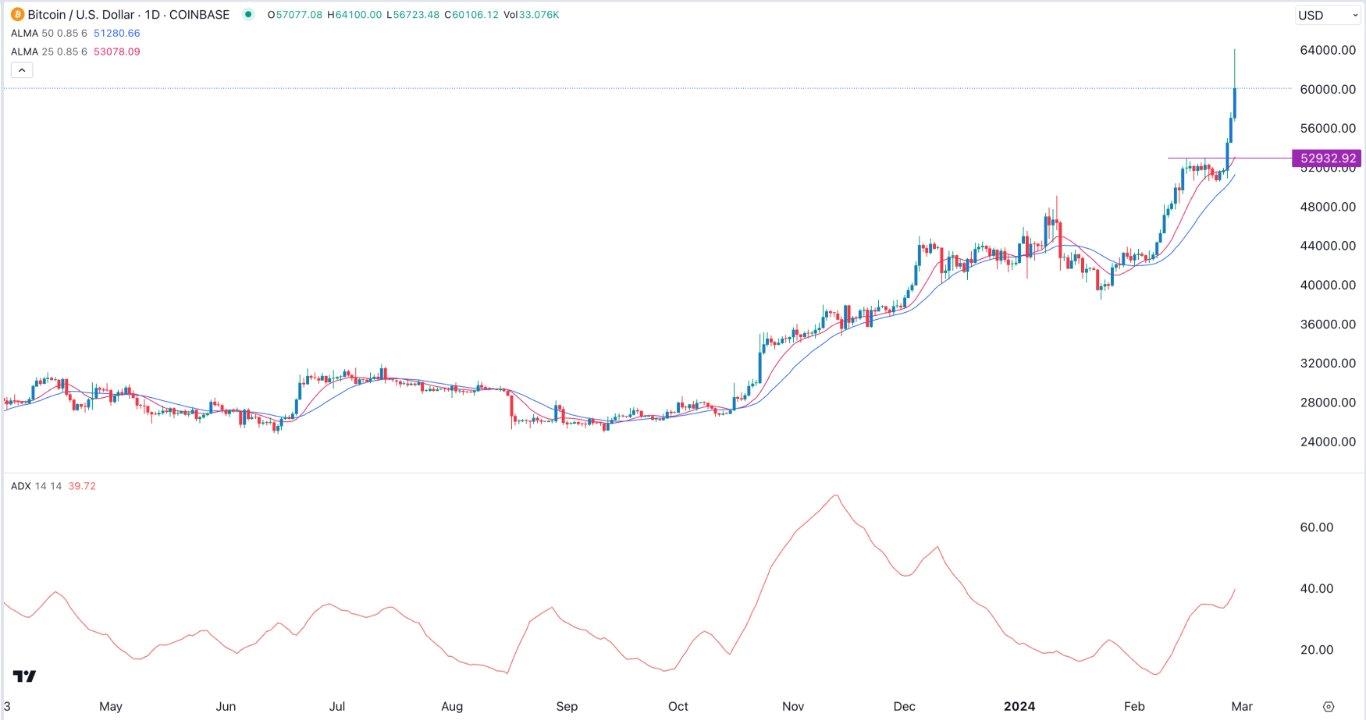
The daily chart shows that the BTC/USD exchange rate has been in a strong bullish trend since 2023. Most recently, the pair rose above the important resistance at 52,932, the higher side of the bullish flag pattern. On Wednesday, it moved above the crucial resistance at 60,000. It has remained above all moving averages while the Average True Range (ATR) has pointed upwards and is at 40.
Therefore, the path of the least resistance for the pair is bullish, with the next point to watch being at its all-time high of 69,000.
Ready to trade our daily Forex signals ? Here's a list of some of the best crypto brokers to check out.
MENAFN02032024000131011023ID1107924947
Legal Disclaimer:
MENAFN provides the information “as is” without warranty of any kind. We do not accept any responsibility or liability for the accuracy, content, images, videos, licenses, completeness, legality, or reliability of the information contained in this article. If you have any complaints or copyright issues related to this article, kindly contact the provider above.