


403
Sorry!!
Error! We're sorry, but the page you were looking for doesn't exist.

S&P 500 Index Outlook Bleak on Trade War Despite Fed Rate Cuts
(MENAFN- DailyFX) S & P 500 INDEX, FED RATE CUTS, US CHINA TRADE WAR – SUMMARY POINTSThe Federal Reserve cut its policy interest rate last month for the first time in a decade which helped push theS & P 500Index to fresh all-time highs Stock market returns are mixed following the start of a Fed rate cut cycle, but recent history and US China trade war risk paints a bleak picture for S & P 500 Index outlook Download the free Q3Equity Forecastfor comprehensive fundamental and technical analysis on the major global stock market indices 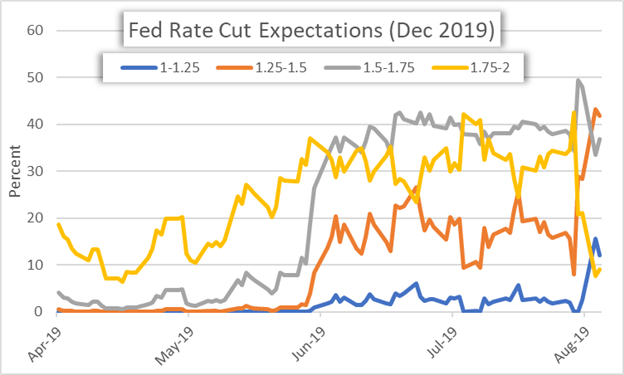
Over the last few months, financial markets have observed a sharpshift in monetary policy outlookfrom the Federal Reserve (Fed). The US central bank has quickly pivoted away from a hawkish stance with 3 rate hikes expected for 2019 this past December to its current dovish position. The new accommodative posturing was confirmed following theJuly Fed meetingwhich revealed a 'mid-cycle adjustment' to monetary policy with a 25-basis point cut to its benchmark interest rate.
Stock market investors were widely expecting the Fed to cut rates last month and drove theS & P 500 Index to notch a string of record-high closesin the runup to the FOMC's decision to ease policy. While Federal Reserve Chair Jerome Powell highlighted weak business investment and tepid inflation as the primary factors contributing to the latest rate cut, mounting downside risks to the economy and investor sentiment – predominantly surrounding theUS China trade war– have largely driven the market's expectations for future monetary policy decisions.
FED RATE CUT EXPECTATIONS & US CHINA TRADE WAR DEVELOPMENTSAccording to overnight swaps, rate traders are now pricing in another 75-basis points of cuts to the Fed's policy interest rate, which currently stands at 2.00-2.25 percent, by the end of the year. Considering that elevated market risks revolving tariffs and the latestUS-China trade warescalationhave contributed to the market anticipating lofty monetary policy easing by the Federal Reserve, it is likely that the Fed will continue to embark down the road of lower interest rates. But will Fed rate cuts be enough to fend off a widespread market downturn from the impact of an ongoing trade spat between the world's largest two economies?
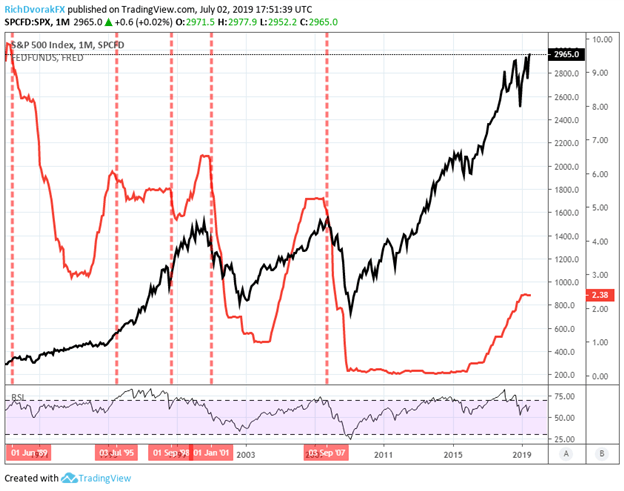
STOCK MARKET PERFORMANCE WHEN THE FED CUTS RATESHistorically speaking, stocks tend to benefit from the onset of lower interest rates from the Federal Reserve. This relationship can be observed in chart 1 below which depicts the monthly change in the S & P 500 Index and the effective federal funds rate (FFR).
S & P 500 INDEX PRICE AND EFFECTIVE FEDERAL FUNDS RATE OVERLAY – CHART 1For the Fed rate cut cycles beginning July 1995, September 1998, January 2001 and September 2007, the S & P 500 Index posted positive returns of 3.18 percent, 6.24 percent, 3.46 percent and 3.58 percent respectively and is detailed below in chart 2. Although, the S & P 500 Index slid a mere -0.79 percent during the month prior to the start of the Fed rate cut cycle beginning June 1989.
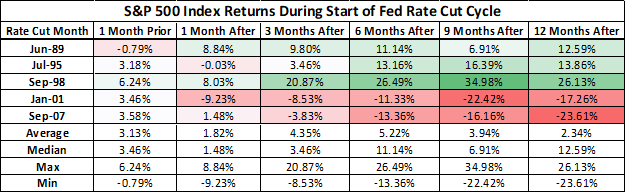
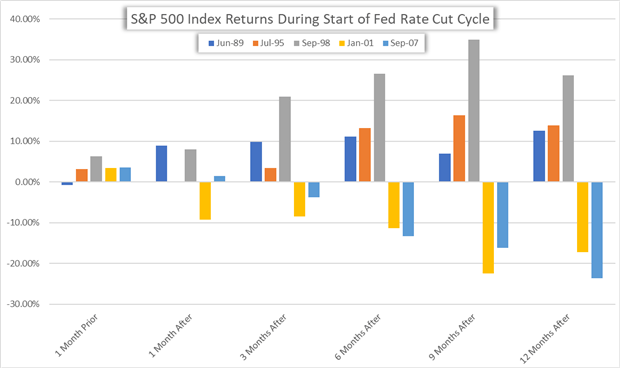
S & P 500 INDEX RETURNS DURING START OF FED RATE CUT CYCLES – CHART 2While the small sample set limits the ability to make statistical inferences, the variance of S & P 500 Index returns rises dramatically in the 3-months, 6-months, 9-months and 12-months following the start of a Fed rate cut cycle. Looking out a year after theFOMCbegins to ease monetary policy, the S & P 500 Index was higher by 12.59 percent, 13.86 percent and 26.13 percent from June 1989, July 1995 and September 1998 whereas the stock market dropped -17.26 percent and -23.61 percent from January 2001 and September 2007.
STOCK MARKET PERFORMANCE WHEN THE FED BEGINS TO EASE MONETARY POLICY – CHART 3Aside from the Sino-American trade conflict, several business cycle indicators – like theyield curve inversion– amid decelerating GDP growth suggests that the global economy is losing momentum quickly and suggest that the latest expansion may be on its last leg.Additionally, economic weakness is being hinted at by muted inflation and fading strength in the US labor market. As such, the drastic deterioration ineconomic dataand ballooning market uncertainty has backed the Fed into a corner with little choice but to juice the slowing economy with monetary stimulus.
S & P 500 INDEX PRICE OUTLOOK WHEN THE FEDERAL RESERVE CUTS INTEREST RATESGenerally-strong equity returns in the month leading up to a Fed rate cut could be explained by the market's hope that the Fed can step in to bolster investor confidence by saving declining asset prices and a slowing economy with looser financial conditions. Also, a reduction in the Fed rate increases the equity term premium and thereby boosts the relative attractiveness of stocks to bonds and other asset classes.
Yet, the S & P 500 Index still managed to sink 6 percent from its all-time high recorded a week ago as the latest flareup in the US China trade war bludgeoned risk assets. This occurred in spite of the Fed rate cut last month and the central bank's conveyed willingness to further ease monetary policy. As such, the overwhelming impact of trade tension between the US and China will likely continue to overshadow Fed rate cuts and bullish prospects for the stock market.
Correspondingly, it is difficult to imagine that the already-diminishingimpact of loosening monetary policycan overcome the daunting headwind posed by global trade friction, decelerating GDP and deteriorating equity earnings. With the Fed controversially cutting rates once already this year, there is arguably less 'monetary policy ammunition' to counter the next downturn. Furthermore, if the macro-economy truly needs as much monetary stimulus as markets are currently pricing, investors could be in for a rude awakening when the longest business cycle in history officially comes to an end.
-- Written byRich Dvorak , Junior Analyst forDailyFX.com
Connect with@RichDvorakFXon Twitter for real-time market insight

Legal Disclaimer:
MENAFN provides the
information “as is” without warranty of any kind. We do not accept
any responsibility or liability for the accuracy, content, images,
videos, licenses, completeness, legality, or reliability of the information
contained in this article. If you have any complaints or copyright
issues related to this article, kindly contact the provider above.
Most popular stories
Market Research

More Story


Comments
No comment