(MENAFN- DailyFX) Oil pricerally vulnerable near-term while below key pivot zone at 60.06/45 Check out our 2019 projections in ourFree DailyFX Oil PriceTrading Forecasts Join Michael for Live Weekly Strategy Webinars onMondays at 12:30GMT
Oil prices rallied more than 19% off the June lows before failing at a key resistance last week and leaves the recent advance in a precarious position heading into the start of the week. These are the updated targets and invalidation levels that matter on thecrude oilweekly price chart (WTI).Review my latest Weekly Strategy Webinarfor an in-depth breakdown of this oil price setup and more.
New to Oil Trading? Get started with this FreeHow to Trade Crude Oil Beginners Guide
Oil Price Chart - WTI Weekly
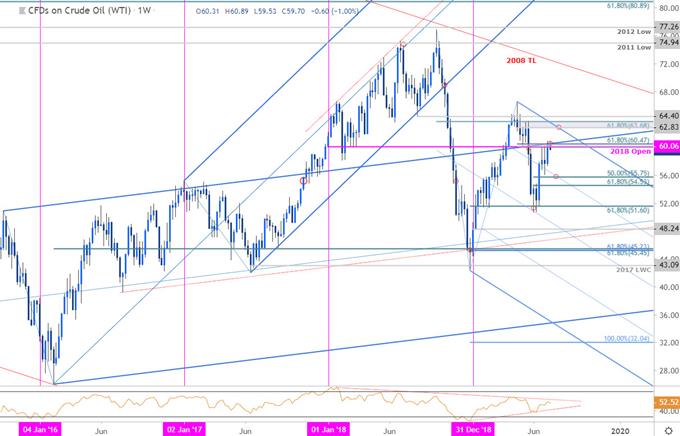
Notes: In my lastOil PriceOutlookwe noted that the crude rally was, 'approaching a critical resistance pivot we've been tracking for months now at 60.06/45 and we're looking for a reaction here.' Oil prices failed to mark a daily close above this threshold and the attempted breach above the monthly opening-range leaves the immediate rally vulnerable while below this key zone.
Monthly open support rests at 58.15 backed by confluence support at the 50%retracementof the June advance at 55.75. Ultimately a break / close below 54.53 would be needed to mark resumption of the broader downtrend. A topside breach above 60.47 would keep the focus on the upper parallel / yearly high-week close at 62.83 – look for a bigger reaction there IF reached. Ultimately a weekly close above 63.68 would be needed to suggest a more significant advance is underway.
For a complete breakdown of Michael's trading strategy, review hisFoundations of Technical Analysis series on Building a Trading Strategy
Bottom line: The immediate oil price advance is vulnerable while below confluence resistance at 60.06/47. From a trading standpoint, a good place to reduce long-exposure / raise protective stops. Be on the lookout for possible topside exhaustion to give way to a larger pullback in crude. I'll publish an updatedOil Price Outlookonce we get further clarity on near-term price action. Review myTop 2019 Trading Opportunitiesfor a look at the longer-term look at theOil Outlook .
Oil Trader Sentiment (WTI)
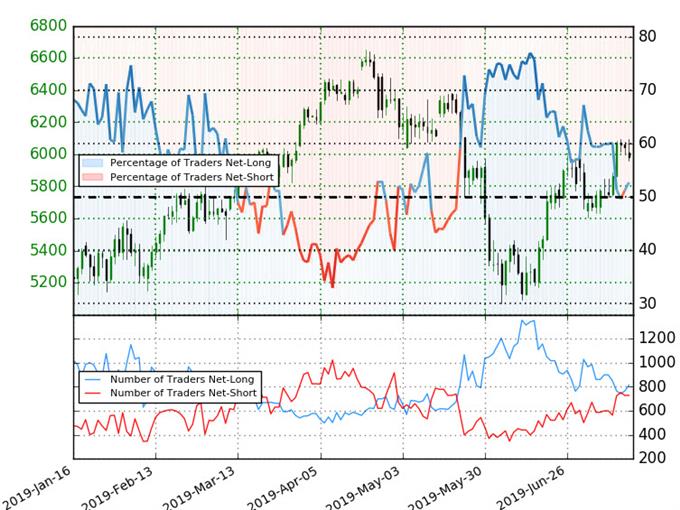
A summary ofIG Client Sentimentshows traders are net-long Crude Oil - the ratio stands at +1.12 (52.8% of traders are long) – bearish reading Long positions are 5.0% higher than yesterday and 9.1% lower from last week Short positions are 7.5% lower than yesterday and 10.0% higher from last week We typically take a contrarian view to crowd sentiment, and the fact traders are net-long suggests Oilprices may continue to fall. Traders are further net-long than yesterday & last week, and the combination of current positioning and recent changes gives us a stronger Crude Oil-bearish contrarian trading bias from a sentiment standpoint.
See how shifts in Crude retail positioning are impacting trend-Learn more about sentiment!
---
Previous Weekly Technical Charts Gold (XAU/USD) Euro (EUR/USD) Canadian Dollar (USD/CAD) Crude Oil (WTI) US Dollar (DXY) Kiwi (NZD/USD)
Learn how to Trade with Confidence in our Free Trading Guide
--- Written byMichael Boutros , Technical Currency Strategist with DailyFX
Follow Michael on Twitter@MBForex
https://www.dailyfx.com/crude-oil/how-to-trade-crude-oil.html?ref-author=Boutros
MENAFN1507201900760000ID1098761267
Legal Disclaimer:
MENAFN provides the information “as is” without warranty of any kind. We do not accept any responsibility or liability for the accuracy, content, images, videos, licenses, completeness, legality, or reliability of the information contained in this article. If you have any complaints or copyright issues related to this article, kindly contact the provider above.