(MENAFN- PR Newswire) NEW YORK, Nov. 24, 2022 /PRNewswire/ --
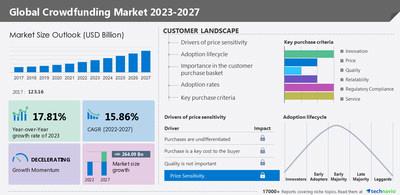
The crowdfunding market size is forecasted to increase by USD 264.09 billion from 2022 to 2027, at a decelerating CAGR of 15.86%, according to a recent market study by Technavio. The growth of the market will be driven by the use of social media for cost-free promotion, easy access to capital, and
an expanding customer base.
continue reading
Technavio has announced its latest market research report titled Global Crowdfunding Market 2023-2027
Technavio categorizes the global crowdfunding market as a part of the global specialized consumer services market, which covers revenue generated by
consumer service providers, including home security services, residential services, legal services, renovation and interior design services, personal services, consumer auction services, wedding services, and funeral services .
Charts & data tables about market and segment sizes for a historic period of five (2017-2021) years have been covered in this report . download the sample report
Technavio has extensively analyzed 15 major vendors, including
Chuffed.org Pty Ltd., CircleUp Network Inc., ConnectionPoint Systems Inc., Crowdcube Ltd., Crowdera Inc., Crowdfunder Inc., DonorsChoose, FUELADREAM Online Ventures Pvt. Ltd., Fundable LLC, GGF Global Ltd., GoFundMe Inc., Indiegogo Inc., Ioby Inc., Ketto Online Ventures Pvt. Ltd., Kickstarter PBC, Kiva Microfunds, Milaap Social Ventures India Pvt. Ltd., Patreon Inc., Seedrs Ltd., and Wishberry Online Services Pvt. Ltd.
Key Benefits for Industry Players & Stakeholders – The report offers information on the criticality of vendor inputs, including R&D, CAPEX, and technology. It also provides detailed analyses of the market's competitive landscape and vendors' product offerings. The report also provides a qualitative and quantitative analysis of vendors to help clients understand the wider business environment as well as the strengths and weaknesses of key market players. Data is qualitatively analyzed to categorize vendors as pure play, category focused, industry focused, and diversified; it is quantitatively analyzed to categorize vendors as dominant, leading, strong, tentative, and weak.
Expand operations in future - To get requisite details,
ask for a custom report .
Customer Landscape - Analysis of Price Sensitivity, Adoption Lifecycle, Customer Purchase Basket, Adoption Rates, and Purchase Criteria by Technavio One of the core components of the customer landscape is
price sensitivity, an
analysis of which
will help companies refine marketing strategies to gain a competitive advantage.
Another key aspect is price sensitivity drivers
( purchases are undifferentiated, purchase is a key cost to buyers, and quality is not important ), which range between LOW and HIGH. Furthermore, market adoption rates for all regions have been covered.
download the sample
to get a holistic overview of the crowdfunding market by industry experts to evaluate and develop growth strategies.
The market is segmented by deployment (cloud and on-premise) and type (P2P lending, equity investment, hybrid, reward, and others).
Segmentation by deployment (Inclusion/Exclusion) The
cloud segment
grew gradually by USD 72.66 billion between 2017 and 2021 . The growth of cloud-based crowdfunding is mainly attributed to increasing globalization and the presence of BFSI companies , which require a centralized system and software. Cloud-based crowdfunding enables these companies to manage, automate, and optimize their recurring and repetitive business processes . Cloud-based software also offers organizations more control over their business processes and helps increase efficiency.
To get detailed insights about inclusions and exclusions, buy report.
Related Reports - microfinance market
by Type and Geography - Forecast and Analysis 2022-2026 – size is estimated to increase by USD 122.46 billion from 2021 to 2026, with an accelerated CAGR of 11.61%, according to the recent market study by Technavio.
Furthermore, this report extensively covers
market
segmentations by type (banks and non-banks) and geography (APAC, South America, North America, Europe, and the Middle East and Africa).
factoring market
by Type, Application, and Geography - Forecast and Analysis 2023-2027 – size is estimated to increase by USD 720.41 billion from 2022 to 2027, with an accelerated CAGR of 7.54%, according to the recent market study by Technavio. The growing need for alternative sources of financing for MSMEs is one of the key factors driving
the market growth.
What are the key data covered in crowdfunding market? CAGR of the market during the forecast period Detailed information on factors that will drive the growth of the
crowdfunding market between 2023 and 2027 Precise estimation of the size of the crowdfunding market size and its contribution to the parent market Accurate predictions about
upcoming trends and changes in consumer behavior Growth of the crowdfunding market
across APAC, North America, Europe, Middle East and Africa, and South America Thorough analysis of the market's competitive landscape and detailed information about vendors Comprehensive analysis of factors that will challenge the growth of crowdfunding market vendors
| Crowdfunding Market Scope |
| Report Coverage | Details |
| Page number | 163 |
| Base year | 2022 |
| Historic Period | 2017 -2021 |
| Forecast period | 2023-2027 |
| Growth momentum & CAGR | Decelerate at a CAGR of 15.86% |
| Market growth 2023-2027 | USD 264.09 billion |
| Market structure | Fragmented |
| YoY growth (%) | 17.81 |
| Regional analysis | APAC, North America, Europe, South America, and the Middle East and Africa |
| Performing contribution | APAC at 62% |
| Key countries | US, Canada, China, Australia, and UK |
| Competitive landscape | Leading companies, Market Positioning of Vendors, Competitive Strategies and Industry Risks |
| Companies profiled | Chuffed.org Pty Ltd., CircleUp Network Inc., ConnectionPoint Systems Inc., Crowdcube Ltd., Crowdera Inc., Crowdfunder Inc., DonorsChoose, FUELADREAM Online Ventures Pvt. Ltd., Fundable LLC, GGF Global Ltd., GoFundMe Inc., Indiegogo Inc., Ioby Inc., Ketto Online Ventures Pvt. Ltd., Kickstarter PBC, Kiva Microfunds, Milaap Social Ventures India Pvt. Ltd., Patreon Inc., Seedrs Ltd., and Wishberry Online Services Pvt. Ltd. |
| Market Dynamics | Parent Market Analysis; Market growth inducers and obstacles; Fast-growing and slow-growing segment analysis for the forecast period |
| Customization preview | If our report has not included the data that you are looking for, you can reach out to our analysts and get segments customized. |
Browse consumer discretionary
Market Reports
Table of Contents 1 Executive Summary
1.1 Market overview
Exhibit 01: Executive Summary – Chart on Market Overview Exhibit 02: Executive Summary – Data Table on Market Overview Exhibit 03: Executive Summary – Chart on Global Market Characteristics Exhibit 04: Executive Summary – Chart on Market by Geography Exhibit 05: Executive Summary – Chart on Market Segmentation by Deployment Exhibit 06: Executive Summary – Chart on Market Segmentation by Type Exhibit 07: Executive Summary – Chart on Incremental Growth Exhibit 08: Executive Summary – Data Table on Incremental Growth Exhibit 09: Executive Summary – Chart on Vendor Market Positioning
2 Market Landscape
2.1 Market ecosystem
Exhibit 10: Parent market Exhibit 11: Market Characteristics
3 Market Sizing
3.1 Market definition
Exhibit 12: Offerings of vendors included in the market definition
3.2 Market segment analysis
Exhibit 13: Market segments
3.4 Market outlook: Forecast for 2022-2027
Exhibit 14: Chart on Global - Market size and forecast 2022-2027 ($ billion) Exhibit 15: Data Table on Global - Market size and forecast 2022-2027 ($ billion) Exhibit 16: Chart on Global Market: Year-over-year growth 2022-2027 (%) Exhibit 17: Data Table on Global Market: Year-over-year growth 2022-2027 (%)
4 Historic Market Size
4.1 Global crowdfunding market 2017 - 2021
Exhibit 18: Historic Market Size – Data Table on Global crowdfunding market 2017 - 2021 ($ billion)
4.2 Geography Segment Analysis 2017 - 2021
Exhibit 19: Historic Market Size – Geography Segment 2017 - 2021 ($ billion)
4.3 Deployment Type Segment Analysis 2017 - 2021 Exhibit 20: Historic Market Size – Deployment Type Segment 2017 - 2021 ($ billion)
4.4 Type Segment Analysis 2017 - 2021
Exhibit 21: Historic Market Size – Type Segment 2017 - 2021 ($ billion)
4.5 Country Segment Analysis 2017 - 2021
Exhibit 22: Historic Market Size – Country Segment 2017 - 2021 ($ billion)
5 Five Forces Analysis
5.1 Five forces summary
Exhibit 23: Five forces analysis - Comparison between 2022 and 2027
5.2 Bargaining power of buyers
Exhibit 24: Chart on Bargaining power of buyers – Impact of key factors 2022 and 2027
5.3 Bargaining power of suppliers
Exhibit 25: Bargaining power of suppliers – Impact of key factors in 2022 and 2027
5.4 Threat of new entrants
Exhibit 26: Threat of new entrants – Impact of key factors in 2022 and 2027
5.5 Threat of substitutes
Exhibit 27: Threat of substitutes – Impact of key factors in 2022 and 2027
5.6 Threat of rivalry
Exhibit 28: Threat of rivalry – Impact of key factors in 2022 and 2027
5.7 Market condition
Exhibit 29: Chart on Market condition - Five forces 2022 and 2027
6 Market Segmentation by Deployment
6.1 Market segments
Exhibit 30: Chart on Deployment - Market share 2022-2027 (%) Exhibit 31: Data Table on Deployment - Market share 2022-2027 (%)
6.2 Comparison by Deployment
Exhibit 32: Chart on Comparison by Deployment Exhibit 33: Data Table on Comparison by Deployment
6.3 Cloud - Market size and forecast 2022-2027 Exhibit 34: Chart on Cloud - Market size and forecast 2022-2027 ($ billion) Exhibit 35: Data Table on Cloud - Market size and forecast 2022-2027 ($ billion) Exhibit 36: Chart on Cloud - Year-over-year growth 2022-2027 (%) Exhibit 37: Data Table on Cloud - Year-over-year growth 2022-2027 (%)
6.4 On-premise - Market size and forecast 2022-2027 Exhibit 38: Chart on On-premise - Market size and forecast 2022-2027 ($ billion) Exhibit 39: Data Table on On-premise - Market size and forecast 2022-2027 ($ billion) Exhibit 40: Chart on On-premise - Year-over-year growth 2022-2027 (%) Exhibit 41: Data Table on On-premise - Year-over-year growth 2022-2027 (%)
6.5 Market opportunity by Deployment
Exhibit 42: Market opportunity by Deployment ($ billion)
7 Market Segmentation by Type
7.1 Market segments
Exhibit 43: Chart on Type - Market share 2022-2027 (%) Exhibit 44: Data Table on Type - Market share 2022-2027 (%)
7.2 Comparison by Type
Exhibit 45: Chart on Comparison by Type Exhibit 46: Data Table on Comparison by Type
7.3 P2P lending - Market size and forecast 2022-2027 Exhibit 47: Chart on P2P lending - Market size and forecast 2022-2027 ($ billion) Exhibit 48: Data Table on P2P lending - Market size and forecast 2022-2027 ($ billion) Exhibit 49: Chart on P2P lending - Year-over-year growth 2022-2027 (%) Exhibit 50: Data Table on P2P lending - Year-over-year growth 2022-2027 (%)
7.4 Equity investment - Market size and forecast 2022-2027 Exhibit 51: Chart on Equity investment - Market size and forecast 2022-2027 ($ billion) Exhibit 52: Data Table on Equity investment - Market size and forecast 2022-2027 ($ billion) Exhibit 53: Chart on Equity investment - Year-over-year growth 2022-2027 (%) Exhibit 54: Data Table on Equity investment - Year-over-year growth 2022-2027 (%)
7.5 Hybrid - Market size and forecast 2022-2027 Exhibit 55: Chart on Hybrid - Market size and forecast 2022-2027 ($ billion) Exhibit 56: Data Table on Hybrid - Market size and forecast 2022-2027 ($ billion) Exhibit 57: Chart on Hybrid - Year-over-year growth 2022-2027 (%) Exhibit 58: Data Table on Hybrid - Year-over-year growth 2022-2027 (%)
7.6 Reward - Market size and forecast 2022-2027 Exhibit 59: Chart on Reward - Market size and forecast 2022-2027 ($ billion) Exhibit 60: Data Table on Reward - Market size and forecast 2022-2027 ($ billion) Exhibit 61: Chart on Reward - Year-over-year growth 2022-2027 (%) Exhibit 62: Data Table on Reward - Year-over-year growth 2022-2027 (%)
7.7 Others - Market size and forecast 2022-2027 Exhibit 63: Chart on Others - Market size and forecast 2022-2027 ($ billion) Exhibit 64: Data Table on Others - Market size and forecast 2022-2027 ($ billion) Exhibit 65: Chart on Others - Year-over-year growth 2022-2027 (%) Exhibit 66: Data Table on Others - Year-over-year growth 2022-2027 (%)
7.8 Market opportunity by Type
Exhibit 67: Market opportunity by Type ($ billion)
8 Customer Landscape
8.1 Customer landscape overview
Exhibit 68: Analysis of price sensitivity, lifecycle, customer purchase basket, adoption rates, and purchase criteria
9 Geographic Landscape
9.1 Geographic segmentation
Exhibit 69: Chart on Market share by geography 2022-2027 (%) Exhibit 70: Data Table on Market share by geography 2022-2027 (%)
9.2 Geographic comparison
Exhibit 71: Chart on Geographic comparison Exhibit 72: Data Table on Geographic comparison
9.3 APAC - Market size and forecast 2022-2027 Exhibit 73: Chart on APAC - Market size and forecast 2022-2027 ($ billion) Exhibit 74: Data Table on APAC - Market size and forecast 2022-2027 ($ billion) Exhibit 75: Chart on APAC - Year-over-year growth 2022-2027 (%) Exhibit 76: Data Table on APAC - Year-over-year growth 2022-2027 (%)
9.4 North America - Market size and forecast 2022-2027 Exhibit 77: Chart on North America - Market size and forecast 2022-2027 ($ billion) Exhibit 78: Data Table on North America - Market size and forecast 2022-2027 ($ billion) Exhibit 79: Chart on North America - Year-over-year growth 2022-2027 (%) Exhibit 80: Data Table on North America - Year-over-year growth 2022-2027 (%)
9.5 Europe - Market size and forecast 2022-2027 Exhibit 81: Chart on Europe - Market size and forecast 2022-2027 ($ billion) Exhibit 82: Data Table on Europe - Market size and forecast 2022-2027 ($ billion) Exhibit 83: Chart on Europe - Year-over-year growth 2022-2027 (%) Exhibit 84: Data Table on Europe - Year-over-year growth 2022-2027 (%)
9.6 South America - Market size and forecast 2022-2027 Exhibit 85: Chart on South America - Market size and forecast 2022-2027 ($ billion) Exhibit 86: Data Table on South America - Market size and forecast 2022-2027 ($ billion) Exhibit 87: Chart on South America - Year-over-year growth 2022-2027 (%) Exhibit 88: Data Table on South America - Year-over-year growth 2022-2027 (%)
9.7 Middle East and Africa - Market size and forecast 2022-2027
Exhibit 89: Chart on Middle East and Africa - Market size and forecast 2022-2027 ($ billion) Exhibit 90: Data Table on Middle East and Africa - Market size and forecast 2022-2027 ($ billion) Exhibit 91: Chart on Middle East and Africa - Year-over-year growth 2022-2027 (%) Exhibit 92: Data Table on Middle East and Africa - Year-over-year growth 2022-2027 (%)
9.8 US - Market size and forecast 2022-2027 Exhibit 93: Chart on US - Market size and forecast 2022-2027 ($ billion) Exhibit 94: Data Table on US - Market size and forecast 2022-2027 ($ billion) Exhibit 95: Chart on US - Year-over-year growth 2022-2027 (%) Exhibit 96: Data Table on US - Year-over-year growth 2022-2027 (%)
9.9 China - Market size and forecast 2022-2027 Exhibit 97: Chart on China - Market size and forecast 2022-2027 ($ billion) Exhibit 98: Data Table on China - Market size and forecast 2022-2027 ($ billion) Exhibit 99: Chart on China - Year-over-year growth 2022-2027 (%) Exhibit 100: Data Table on China - Year-over-year growth 2022-2027 (%)
9.10 Australia - Market size and forecast 2022-2027 Exhibit 101: Chart on Australia - Market size and forecast 2022-2027 ($ billion) Exhibit 102: Data Table on Australia - Market size and forecast 2022-2027 ($ billion) Exhibit 103: Chart on Australia - Year-over-year growth 2022-2027 (%) Exhibit 104: Data Table on Australia - Year-over-year growth 2022-2027 (%)
9.11 Canada - Market size and forecast 2022-2027 Exhibit 105: Chart on Canada - Market size and forecast 2022-2027 ($ billion) Exhibit 106: Data Table on Canada - Market size and forecast 2022-2027 ($ billion) Exhibit 107: Chart on Canada - Year-over-year growth 2022-2027 (%) Exhibit 108: Data Table on Canada - Year-over-year growth 2022-2027 (%)
9.12 UK - Market size and forecast 2022-2027 Exhibit 109: Chart on UK - Market size and forecast 2022-2027 ($ billion) Exhibit 110: Data Table on UK - Market size and forecast 2022-2027 ($ billion) Exhibit 111: Chart on UK - Year-over-year growth 2022-2027 (%) Exhibit 112: Data Table on UK - Year-over-year growth 2022-2027 (%)
9.13 Market opportunity by geography
Exhibit 113: Market opportunity by geography ($ billion)
10 Drivers, Challenges, and Trends
10.3 Impact of drivers and challenges
Exhibit 114: Impact of drivers and challenges in 2022 and 2027
11 Vendor Landscape
11.2 Vendor landscape
Exhibit 115: Overview on Criticality of inputs and Factors of differentiation
11.3 Landscape disruption
Exhibit 116: Overview on factors of disruption
11.4 Industry risks
Exhibit 117: Impact of key risks on business
12 Vendor Analysis
12.1 Vendors covered
Exhibit 118: Vendors covered
12.2 Market positioning of vendors
Exhibit 119: Matrix on vendor position and classification
12.3 Chuffed.org Pty Ltd.
Exhibit 120: Chuffed.org Pty Ltd. - Overview Exhibit 121: Chuffed.org Pty Ltd. - Product / Service Exhibit 122: Chuffed.org Pty Ltd. - Key offerings
12.4 CircleUp Network Inc.
Exhibit 123: CircleUp Network Inc. - Overview Exhibit 124: CircleUp Network Inc. - Product / Service Exhibit 125: CircleUp Network Inc. - Key offerings
12.5 ConnectionPoint Systems Inc.
Exhibit 126: ConnectionPoint Systems Inc. - Overview Exhibit 127: ConnectionPoint Systems Inc. - Product / Service Exhibit 128: ConnectionPoint Systems Inc. - Key offerings
12.6 Crowdcube Ltd.
Exhibit 129: Crowdcube Ltd. - Overview Exhibit 130: Crowdcube Ltd. - Product / Service Exhibit 131: Crowdcube Ltd. - Key offerings
12.7 Crowdfunder Inc.
Exhibit 132: Crowdfunder Inc. - Overview Exhibit 133: Crowdfunder Inc. - Product / Service Exhibit 134: Crowdfunder Inc. - Key offerings
12.8 DonorsChoose
Exhibit 135: DonorsChoose - Overview Exhibit 136: DonorsChoose - Product / Service Exhibit 137: DonorsChoose - Key offerings
12.9 Fundable LLC
Exhibit 138: Fundable LLC - Overview Exhibit 139: Fundable LLC - Product / Service Exhibit 140: Fundable LLC - Key offerings
12.10 GGF Global Ltd.
Exhibit 141: GGF Global Ltd. - Overview Exhibit 142: GGF Global Ltd. - Product / Service Exhibit 143: GGF Global Ltd. - Key offerings
12.11 GoFundMe Inc.
Exhibit 144: GoFundMe Inc. - Overview Exhibit 145: GoFundMe Inc. - Product / Service Exhibit 146: GoFundMe Inc. - Key offerings
12.12 Indiegogo Inc.
Exhibit 147: Indiegogo Inc. - Overview Exhibit 148: Indiegogo Inc. - Product / Service Exhibit 149: Indiegogo Inc. - Key news Exhibit 150: Indiegogo Inc. - Key offerings
12.13 Ioby Inc.
Exhibit 151: Ioby Inc. - Overview Exhibit 152: Ioby Inc. - Product / Service Exhibit 153: Ioby Inc. - Key offerings
12.14 Ketto Online Ventures Pvt. Ltd.
Exhibit 154: Ketto Online Ventures Pvt. Ltd. - Overview Exhibit 155: Ketto Online Ventures Pvt. Ltd. - Product / Service Exhibit 156: Ketto Online Ventures Pvt. Ltd. - Key offerings
12.15 Kickstarter PBC
Exhibit 157: Kickstarter PBC - Overview Exhibit 158: Kickstarter PBC - Product / Service Exhibit 159: Kickstarter PBC - Key offerings
12.16 Kiva Microfunds
Exhibit 160: Kiva Microfunds - Overview Exhibit 161: Kiva Microfunds - Product / Service Exhibit 162: Kiva Microfunds - Key offerings
12.17 Patreon Inc.
Exhibit 163: Patreon Inc. - Overview Exhibit 164: Patreon Inc. - Product / Service Exhibit 165: Patreon Inc. - Key offerings
13 Appendix
13.2 Inclusions and exclusions checklist
Exhibit 166: Inclusions checklist Exhibit 167: Exclusions checklist
13.3 Currency conversion rates for US$
Exhibit 168: Currency conversion rates for US$
13.4 Research methodology
Exhibit 169: Research methodology Exhibit 170: Validation techniques employed for market sizing Exhibit 171: Information sources
13.5 List of abbreviations
Exhibit 172: List of abbreviations
About Us Technavio is a leading global technology research and advisory company. Their research and analysis focus on emerging market trends and provide actionable insights to help businesses identify market opportunities and develop effective strategies to optimize their market positions. With over 500 specialized analysts, Technavio's report library Their client base consists of enterprises of all sizes, including more than 100 Fortune 500 companies. This growing client base relies on Technavio's comprehensive coverage, extensive research, and actionable market insights to identify opportunities in existing and potential markets and assess their competitive positions within changing market scenarios.
Contact Technavio ResearchJesse MaidaMedia & Marketing ExecutiveUS: +1 844 364 1100UK: +44 203 893 3200Email: [email protected] Website:
SOURCE Technavio