(MENAFN- DailyFX)Gold Technical Price Outlook: XAU/USD Weekly Trade Levels
- updated technical trade levels - Weekly Chart
- XAU/ breakout surges into major technical resistance at 1850- constructive above 1764
- New to Trading? Get started with this Free
Advertisement
surged more than 10.6% off the yearly low with the XAU/ breakout within striking distance of key technical resistance. While the broader outlook remains constructive for the yellow metal, the immediate advance may be vulnerable here as price probes multi-month highs near uptrend extremes. We’re on the lookout for possible inflection up here with bulls vulnerable into 1850. These are the updated targets and invalidation levels that matter on the gold weekly charts. for an in-depth breakdown of this gold technical setup and more.

Gold Price Chart - XAU/USD Weekly
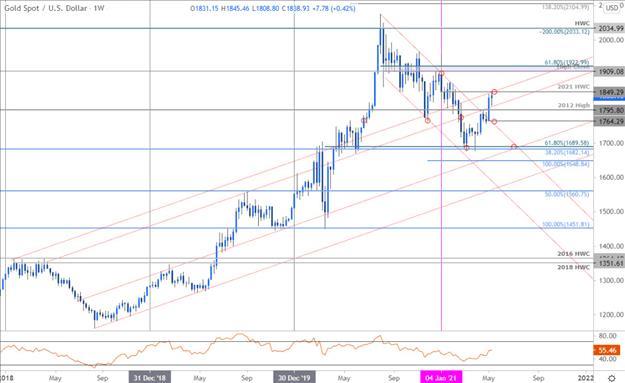
Chart Prepared by , Technical Strategist;
Notes: In last month’s we showed that XAU/USD was testing the 2020 August while noting that, ''A breach / close above this key zone would likely fuel another bout of accelerated gains with such a scenario exposing the objective yearly high-week reversal close at 1849.” Gold ripped higher into the May open with a breakout of the bear flag formation fueling a rally of more than 4.6% to register a high this week at 1845 before pulling back this week. So is this breakout a larger scale reversal?
The immediate focus is on this key resistance threshold with the broader recovery vulnerable near-term while below 1849. Initial weekly rests with the 2012 high at 1795 with bullish invalidation now raised to the objective May open at 1764- a close below this level would suggest a reversal of the broader March rally. A topside breach / close above 1850 would be needed to mark resumption with such a scenario exposing subsequent objectives into the yearly open at 1898 and key resistance at the 2011 high-close / 61.8% retracement at 1909/23- look for a larger reaction there IF reached.

Bottom line: A breakout in Gold is within striking distance of the 2021 high-week reversal-close at 1849 and we’re looking for a reaction / possible inflection up here. From a trading standpoint, a good zone to reduce long-exposure / raise protective stops – be on the lookout for downside exhaustion ahead of 1795 IF price is indeed heading higher on this stretch. Review my latest for a closer look at the near-term XAU/USD technical trade levels.
For a complete breakdown of Michael’s trading strategy, review his
Gold Trader Sentiment – XAU/USD Price Chart
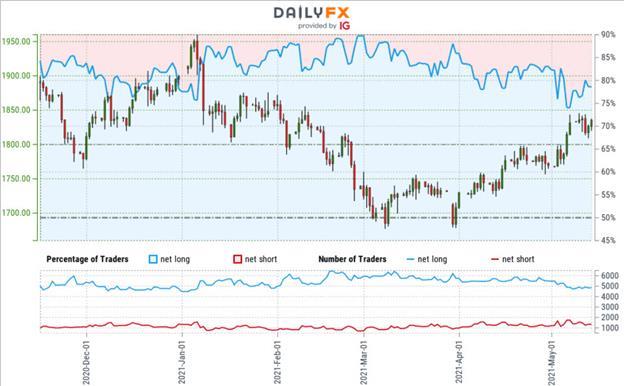
- A summary of shows traders are net-long Gold- the ratio stands at +3.71 (78.77% of traders are long) – typically bearishreading
- Long positions are0.18% lower than yesterday and 5.19% lower from last week
- Short positions are0.38% higher than yesterday and 19.04% lower from last week
- We typically take a contrarian view to crowd sentiment, and the fact traders are net-long suggests Gold prices may continue to fall. Traders are less net-long than yesterday but more net-long from last week and the combination of current positioning and recent changes gives us a further mixed Gold trading bias from a standpoint.
---
Previous Weekly Technical Charts
- Written by , Currency Strategist with DailyFX
Follow Michael on Twitter
MENAFN15052021000076011015ID1102085438
Legal Disclaimer:
MENAFN provides the information “as is” without warranty of any kind. We do not accept any responsibility or liability for the accuracy, content, images, videos, licenses, completeness, legality, or reliability of the information contained in this article. If you have any complaints or copyright issues related to this article, kindly contact the provider above.