(MENAFN- DailyFX) Gold Technical Price Outlook: XAU/USD Weekly Trade Levels
- Gold price updated technical trade levels - Weekly Chart
- XAU/USD plunges throughout critical support- risk for further losses heading into March
- New to Gold Trading? Get started with this Free How to Trade Gold -Beginners Guide
Advertisement
Gold prices plummeted more than 3.3% this week with XAU/USD breaking below key technical support to fresh yearly lows. The losses mark the largest weekly decline this year with the plunge risking a deeper correction in the yellow metal heading into March trade. These are the updated targets and invalidation levels that matter on the gold weekly charts into the close of the month. Review my latest Weekly Strategy Webinar for an in-depth breakdown of this gold technical setup and more.

Gold Price Chart - XAU/USD Weekly
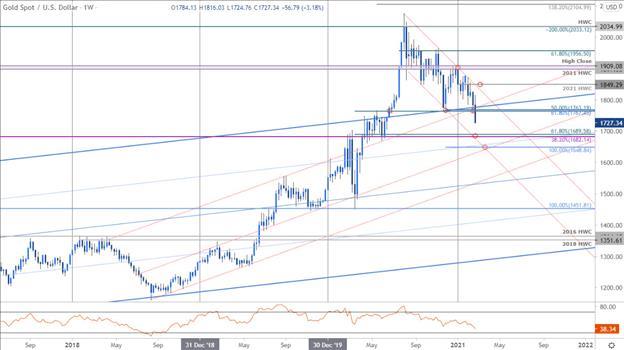
Chart Prepared by Michael Boutros , Technical Strategist; Gold on Tradingview
Notes: In my last Gold Weekly PriceOutlook we noted that XAU/USD was, 'now targeting confluence support near the November lows around 1763/67 and we're looking for inflection here… Note that a break below this confluence zone would likely yield another leg of accelerated losses. A break below this key zone on Friday has fueled the next leg of the decline in gold with price poised to mark the largest daily decline since January 8th and the largest weekly decline since November.
Initial weekly support levels unchanged at the 38.2% Fibonacci retracement of the of the 2015 advance / 61.8% retracement of the 2020 range at 1682/89. Ultimately, a break / weekly close below confluent support at the 100% extension at 1648 would be needed to suggest a deeper correction is underway- look for a larger reaction there IF reached. Resistance now back at 1767 with broader bearish invalidation lowered to the yearly high-week reversal close at 1849.

Bottom line: Gold has broken below a critical support confluence we've been tracking for months now and the risk remains for further losses while below this threshold in the weeks ahead. From at trading standpoint, look to reduce short-exposure / lower protective stops on a move towards 1682/89- topside rebounds should be limited to the upper parallel IF price is indeed heading lower. As always, use added caution and stay nimble here into the weekly / monthly close. Review my latest Gold Price Outlook for a closer look at the near-term XAU/USD technical trading levels.
For a complete breakdown of Michael's trading strategy, review his Foundations of Technical Analysis series on Building a Trading Strategy
Gold Trader Sentiment XAU/USD Price Chart
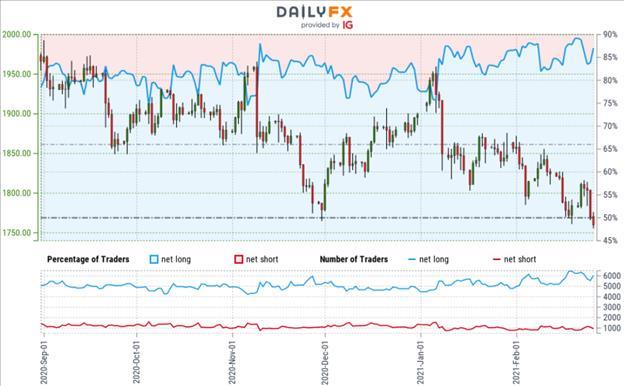
- A summary of IG Client Sentiment shows traders are net-long Gold- the ratio stands at +5.43 (84.45% of traders are long) typically bearishreading
- Long positions are4.93% higher than yesterday and 7.64% lower from last week
- Short positions are15.86% lower than yesterday and 9.80% higher from last week
- We typically take a contrarian view to crowd sentiment, and the fact traders are net-long suggests Gold prices may continue to fall. Traders are more net-long than yesterday but less net-long from last week. The combination of current positioning and recent changes gives us a further mixed Gold trading bias from a sentiment standpoint.
---
Previous Weekly Technical Charts
- Crude Oil (WTI)
- Canadian Dollar (USD/CAD)
- Sterling (GBP/USD)
- Euro (EUR/USD)
- US Dollar (DXY)
- Japanese Yen (USD/JPY)
- Written by Michael Boutros , Currency Strategist with DailyFX
Follow Michael on Twitter @MBForex
MENAFN26022021000076011015ID1101669850
Legal Disclaimer:
MENAFN provides the information “as is” without warranty of any kind. We do not accept any responsibility or liability for the accuracy, content, images, videos, licenses, completeness, legality, or reliability of the information contained in this article. If you have any complaints or copyright issues related to this article, kindly contact the provider above.