(MENAFN- FxPro) 
- Natural Gas reversed from resistance area
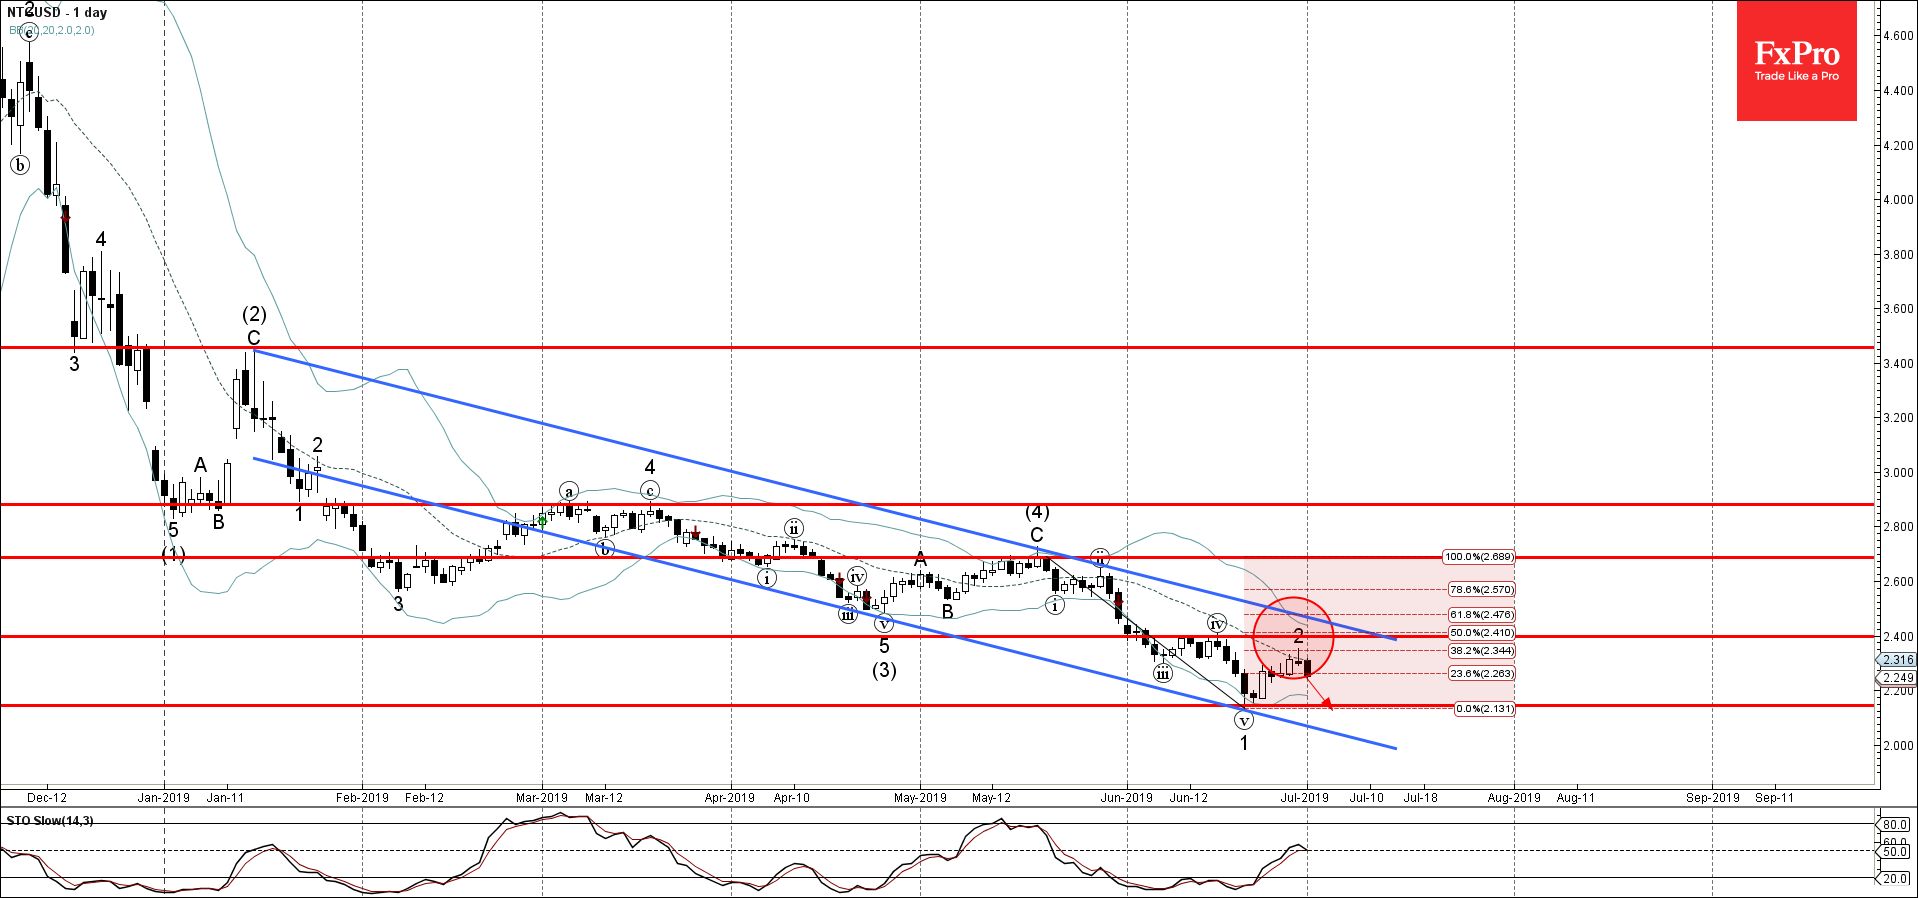
- Further losses are likely
Natural Gas recently reversed down from the resistance area lying between the resistance level 2.400 (top of the previous wave (iv) in June), upper daily Bollinger Band and the 50% Fibonacci correction of the previous downward impulse 1 from May.
The downward reversal from this resistance area started the active short-term impulse wave 3 of the medium-term impulse sequence (5) from May.
Natural Gas is expected to fall further and retest the next support level 2.145 (low of the previous impulse wave 1).
Source:FxPro
MENAFN0207201901560000ID1098712243
Legal Disclaimer:
MENAFN provides the information “as is” without warranty of any kind. We do not accept any responsibility or liability for the accuracy, content, images, videos, licenses, completeness, legality, or reliability of the information contained in this article. If you have any complaints or copyright issues related to this article, kindly contact the provider above.