(MENAFN- DailyFX) GBP/JPYPrice Outlook, Charts and Analysis
Markets are pricing in UK PM Theresa May's exit from 10 Downing Street. GBP/JPY is currently trading at its lowest level in more than four months. Download the Q2 GBP and JPY forecastsand discover what is likely to move the price through mid-year!
Find out more aboutGBPandJPYdata releases for this week from theDailyFX Economic Calendar
Just getting started?See our Beginners' Guide for FX traders
GBP/JPY - Sellers Remain in Charge On May 6, GBP/JPY opened with a downside breakaway gap starting a fresh movement lower. On May 13 the price opened with a measuring gap to the downside showing more weakness and pushing lower to carve a lower low on May 17 at 139.55.
On May 21 GBP/JPY rallied towards 141.74. However, the pair pulled back in the same day and closed below 140.50 reflecting buyer hesitation. Alongside this development, the relative strength indicator (RSI) failed to break above (30) and continued moving within the oversold territory, emphasizing the strength of the bearish momentum.
Today the GBP/JPY hit the levels we mentioned in last week article. Read More:Further Bearish Momentum Hints at 139.00
GBP/JPY DAILY PRICE CHART (FeB 2019 - MAY 23, 2019)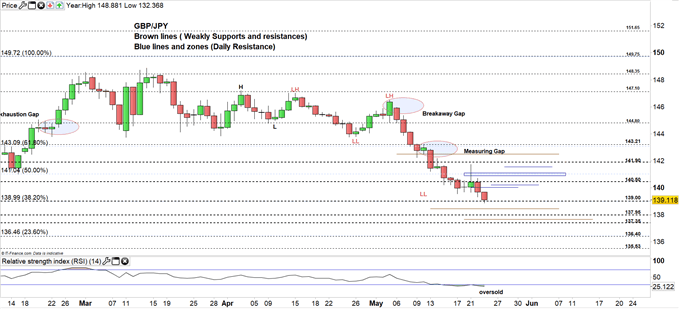 Looking at the GBP/JPY daily chart shows the price testing the low end of the current trading range (139.00 – 140.50). If the pair close today below 139.00 the price may edge lower to test 137.95. Weekly support level at 138.46 is worth monitoring. A close below 137.95 will take GBP/JPY to a lower territory hinting towards 137.35. Weekly support at 137.66 needs to be kept in focus.
Any close above 139.00 could push the price towards the high end of the trading range mentioned above. Daily resistance levels at 140.02 and 140.22 must be watched closely. If the price closes above 140.50 this will move it to the higher trading range (140.50 – 141.90) GBP/JPY could push to test the high end however. The resistance zone at 140.90 – 141.10 and daily resistance at 141.56 need to be monitored along the way.
Having trouble with your trading strategy?Here's the #1 Mistake That Traders Make
GBP/JPY Two-HOUR PRICE CHART (MAY 9 - 23, 2019)
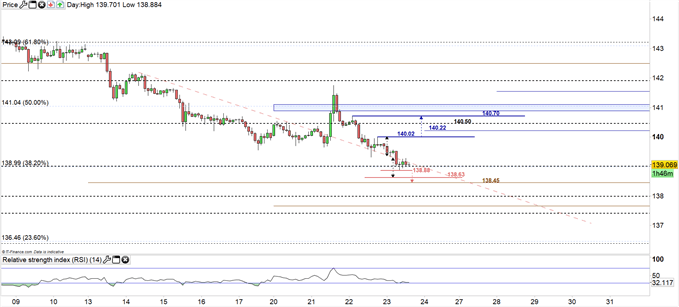
A closer look at the GBP/JPY two-hour chart, we notice the pair closed and traded below the downtrend line originated from May 14 high at 142.15. If the price remaines below 139.15 and breaks below today's lowest price at 138.88, a bearish sentiment would suggest the price falls towards the weekly support mentioned above. Potential rebound level could be at 138.63, see the chart.
Yesterday, GBP/JPY created a high at 140.02. If the price breaks above this threshold it could rally towards the next high at 140.70. Resistance levels mentioned above need to be considered.
Written By:Mahmoud Alkudsi
Please feel free to contact me on Twitter: @Malkudsi
MENAFN2305201900760000ID1098561487
Legal Disclaimer:
MENAFN provides the information “as is” without warranty of any kind. We do not accept any responsibility or liability for the accuracy, content, images, videos, licenses, completeness, legality, or reliability of the information contained in this article. If you have any complaints or copyright issues related to this article, kindly contact the provider above.