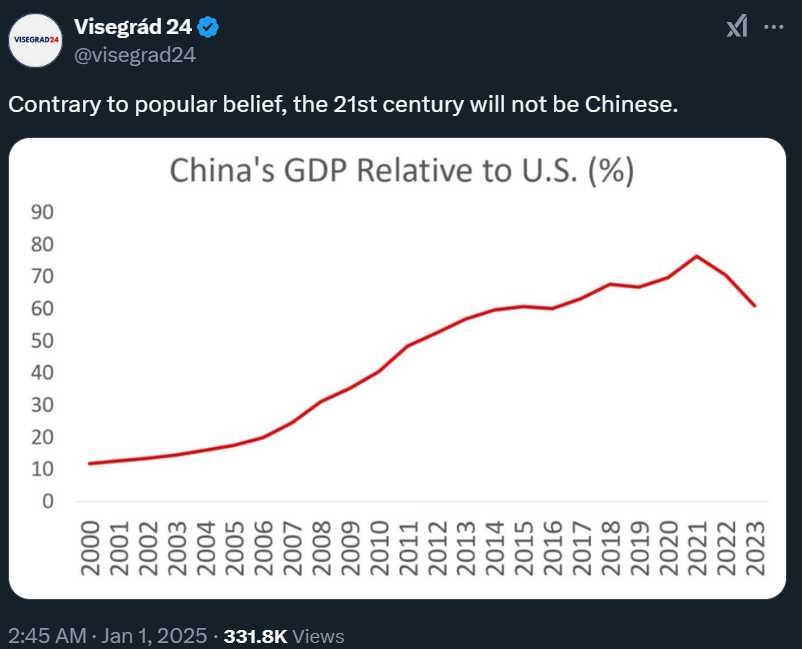
Is China's Economy 'Ahead' Of America's?

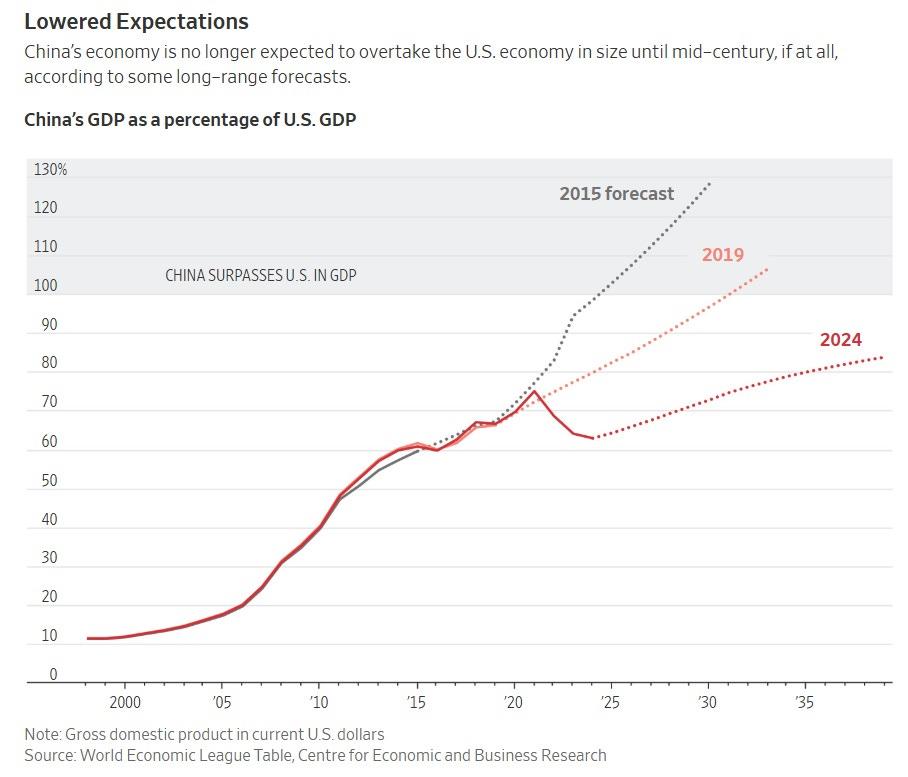
Here's a more detailed version, from Jason Douglas and Ming Li in the WSJ, showing how forecasts of the sizes of the two economies have changed over time:

Source:
WSJ
In Bloomberg, Hal Brands cites this data to support his argument that the US is still ahead of China in terms of global power:
So if you just look at this data, you might get the impression that China's economy is falling behind America's and will fail to catch up in the future. But then if you read the news, you hear that China's GDP is growing at a rate of“around 5%” , while the US grew at only 3.1% in 2024. That's a strong year for the US, but it's not clear how China's economy could be falling behind America's if its growth rate is higher!
The discrepancy here actually has nothing to do with whether or not China's GDP growth is overstated. Yes, it's possible that this is the case - for example,
Rhodium Group guesstimates
that China's actual growth in 2024 was under 3%. But the charts above actually take the Chinese government's 5% figure at face value. So why do they show China falling behind America?
The actual reason for the discrepancy is that there are different ways of comparing GDP. The two basic measures are:
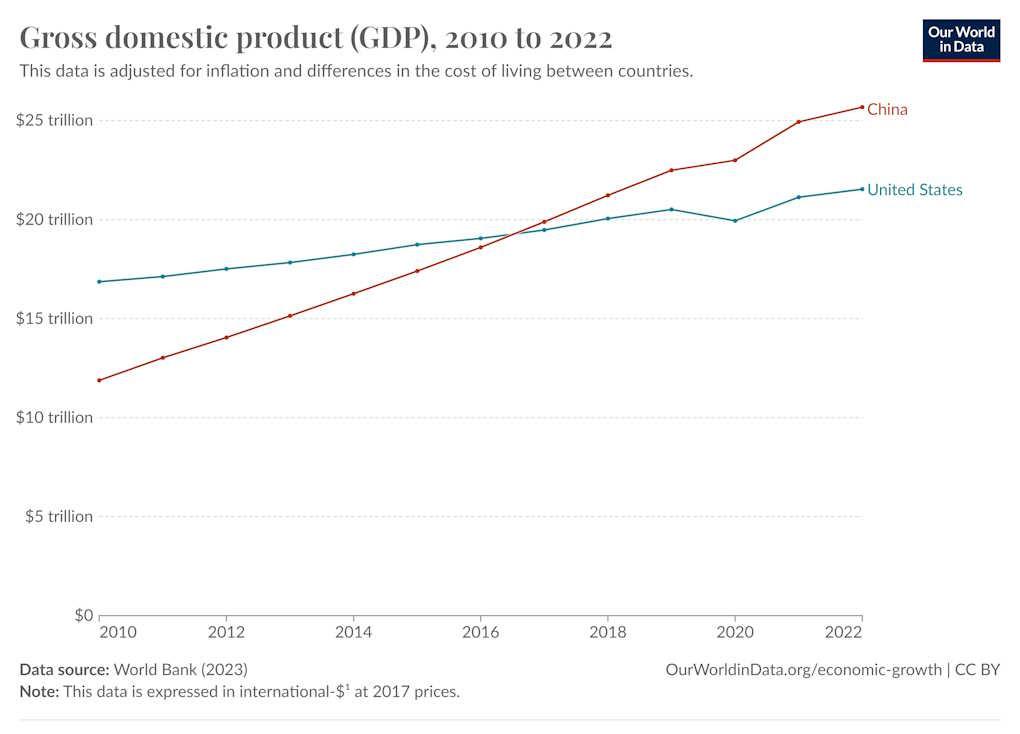
GDP at market exchange rates, also called“nominal” GDP at purchasing power parity (PPP), also called“international dollars”, also called“adjusted for differences in the cost of living”If you use the first of these measures, you see China's GDP falling behind America's, as in the two charts above. But if you use the second measure, you see China's GDP already ahead of America's, and pulling farther ahead every year (albeit at a slower rate than before 2021):

You'll notice that this chart says“adjusted for...differences in the cost of living between countries”, and“international $.” That means PPP.
Market exchange rate GDP is measured in US dollars. You just take a country's GDP numbers (which are measured in its domestic currency), convert that number to dollars using the current exchange rate, and that's the country's“nominal” GDP.
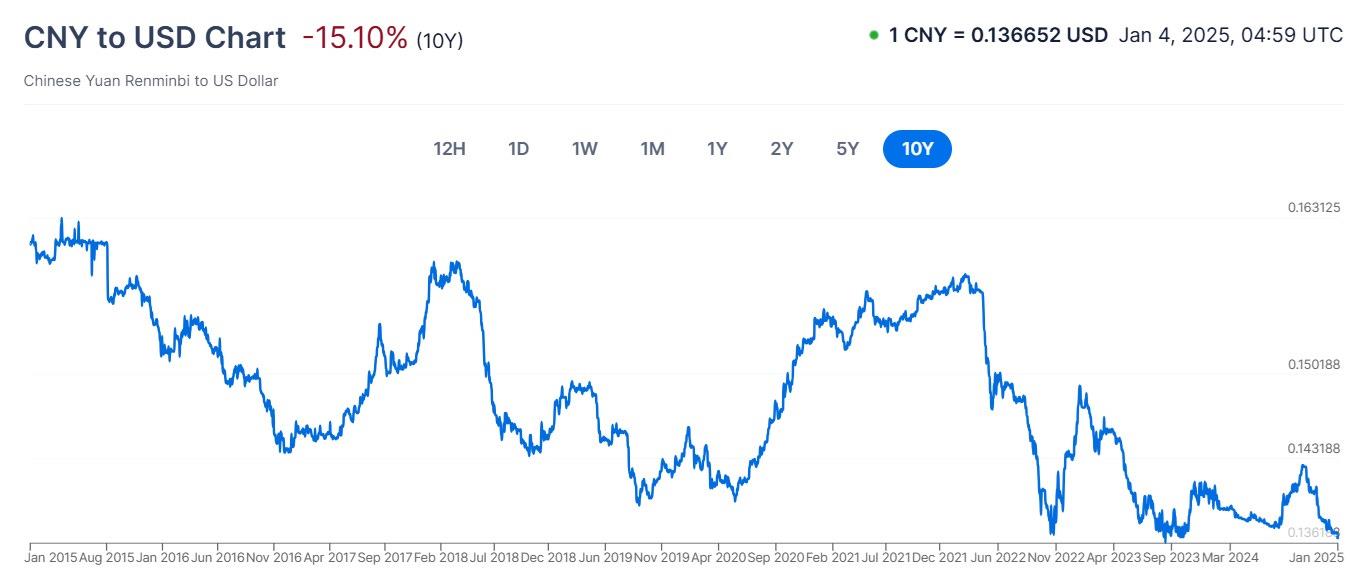
That's pretty easy to calculate and measure. But it means that when exchange rates shift, it makes it look like the relative sizes of different economies also shift, even if they all produce the exact same amount of stuff as before. In this case, it turns out that China's currency (the yuan or RMB) has been depreciating against the US dollar for years.
Here's a chart of how many dollars one Chinese yuan can buy:

Source:
Xe
You'll notice that the yuan was a little bit strong in early 2021 but that in late 2021, its value fell a lot. That's a big part of the reason that China's nominal GDP fell relative to America's over the last three years. The slowdown in China's official real growth rate was part of the drop, but much of it was just an effect of the cheaper yuan.
In fact, the forecasts that show China failing to catch up to America over the next 15 years are almost certainly assuming that the yuan stays cheap. If the yuan appreciates, China's nominal GDP will suddenly look like it jumped up.
In fact, if China lets the yuan rise a lot, it will look like China's economy suddenly overtook America's in size - this is what happened in the late 1980s when Japan allowed its yen to appreciate, and Japan's nominal GDP suddenly looked like it was almost as big as America's.
Whether market exchange rates are a good way of comparing countries' GDP is a subject of debate. On one hand, it's easy to measure, because exchange rates themselves are clear and unambiguous. And if you care about how many imports two different countries can buy, then market exchange rate GDP is obviously the right comparison. When China's currency gets weaker, it means China can afford fewer imports.

Legal Disclaimer:
MENAFN provides the
information “as is” without warranty of any kind. We do not accept
any responsibility or liability for the accuracy, content, images,
videos, licenses, completeness, legality, or reliability of the information
contained in this article. If you have any complaints or copyright
issues related to this article, kindly contact the provider above.


Comments
No comment