(MENAFN- PR Newswire)
Growth plan transitions Plutonic to new, virgin, ore sources
A 105% growth in Reserves over the last 12-months has allowed Catalyst to provide three-year production guidance, increasing annual Gold production from 100koz to 200koz
Encouragingly, Catalyst's existing infrastructure enables this production growth for only A$31m
The low capital intensity of this growth, allows Catalyst to commit greater funds to exploration in FY2025 – A$25m has been committed to exploration with the opportunity to allocate more should exploration results justify it
After generating A$54m of free cash flow in FY2024, with cash and bullion today of A$44m, Catalyst is well placed to fund these plans over the coming 12 to 18 months
Upon conclusion of the 18-month program, Plutonic plans to be mining four different virgin ore sources, feeding a single centralised processing plant
In so doing, Catalyst intends to create a strong foundation for the Company's future, whether that be inorganic growth or exploration only on the Plutonic Gold Belt
PERTH, Australia, Sept. 13, 2024 /PRNewswire/ - Catalyst Metals Limited ( Catalyst or the Company ) (ASX: CYL) is pleased to provide its three-year production guidance and announce an update of its Group Ore Reserve Estimate (ORE).
Catalyst's Ore Reserves now total 1Moz of gold. Importantly, these Reserves provide the foundation for Catalyst's three-year production guidance, growing production from 100koz to 200koz.
Continue Reading
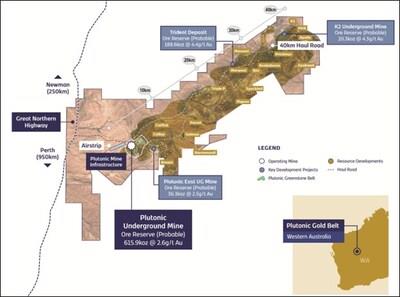
Figure 1: Plutonic Gold Belt (CNW Group/Catalyst Metals LTD.)
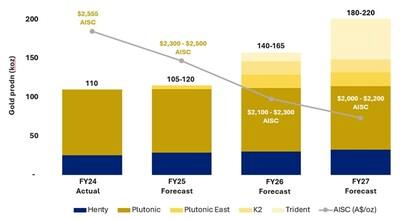
Catalyst Three-Year Production and Cost Guidance - Figure 2: Three year mine plan production and costs (CNW Group/Catalyst Metals LTD.)
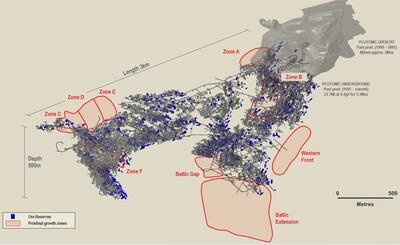
Figure 3: Nine new areas identified after analysing +40 years of historical drilling showing mineralisation extending into these areas (CNW Group/Catalyst Metals LTD.)
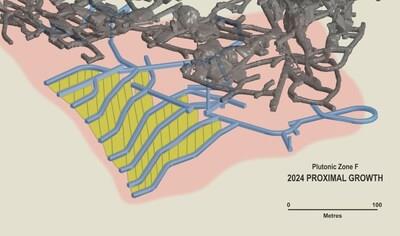
Figure 4: Zone F is the first of nine areas of in-mine exploration at Plutonic. With recent positive results, Catalyst believes it will delineate a new mining area, offering clean new virgin ore sources to Plutonic. (CNW Group/Catalyst Metals LTD.)
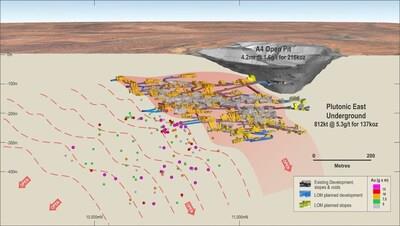
Figure 5: Plutonic East's mine plan showing mineralisation immediately adjacent to planned work areas. This area is the subject of a drill program aimed at extending the mine's life out to five years. (CNW Group/Catalyst Metals LTD.)
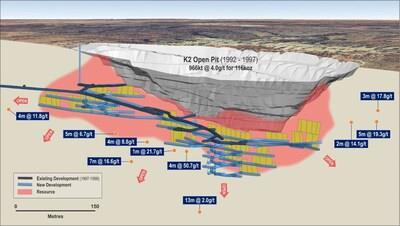
Figure 6: K2 showing potential extensions to the current mine life (CNW Group/Catalyst Metals LTD.)
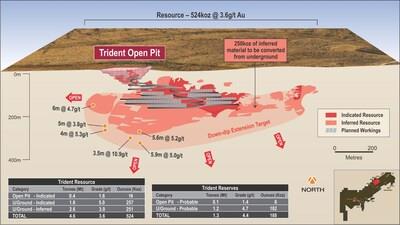
Figure 7: Trident long section showing inferred material targeted for resource conversion and mine life extension (CNW Group/Catalyst Metals LTD.)
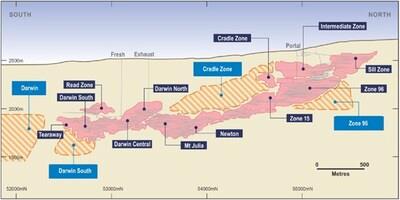
Figure 8: Henty Underground long section showing Mineral Resource and exploration zones. (CNW Group/Catalyst Metals LTD.)
Appendix 1, Section 3, Estimation and modelling techniques - Commentary - Table (CNW Group/Catalyst Metals LTD.)
Appendix 2, Section 3, Estimation and modelling techniques - Commentary - Table (CNW Group/Catalyst Metals LTD.)
Appendix 4, Section 4, Metallurgical factors or assumptions - Commentary - Chart (CNW Group/Catalyst Metals LTD.)
The production growth to 200koz will come for total pre-production capital cost of A$31m. Importantly, it also transitions the Plutonic gold mine from a remnant mine to a new one.
This A$31m is spread across 18 months and three separate mine developments – Plutonic East, K2 and Trident. Each development will occur one after the other.
In addition, a A$25m exploration campaign is planned for FY2025. This includes a Resource drill out of each of the three deposits Plutonic East, K2 and Trident in an effort to extend their mine lives to five years and at annual gold production of greater than 20koz each. It also includes drilling out of each of the nine new in-mine areas at Plutonic and a A$7m 20,000m RC exploration program along two distinct corridors along the Plutonic belt – the Overthrust and Cinnamon corridors – designed to generate future Resource targets.
Catalyst's Managing Director and CEO, James Champion de Crespigny, said:
"Catalyst has today provided to the market its three-year growth plan which is underwritten by 1Moz of Reserves.
A year after consolidating the Plutonic Gold Belt, Catalyst has a strong balance sheet, stable operating cashflows and a pipeline of low-cost developments.
What is all the more exciting is the opportunity to now turn our attention to growth through exploration.
The Plutonic gold belt is an attractive exploration opportunity with the very real possibility of a significant discovery. The historically fractured and foreign ownership of Plutonic has led to a considerable lack of exploration along the belt. Furthermore, the fact it is a brownfields opportunity, without the need for Catalyst to go chasing potentially dilutive capital, is very exciting.
We plan to aggressively drill out and expand these three new mines – Plutonic East, K2 and Trident– well beyond their current life, along with dedicating the required capital to make further discoveries along the belt."
3-Year Production Guidance
Catalyst has updated and released multiple new Ore Reserves. In doing so, it has grown Ore Reserves to 1Moz in Reserves. These lay the foundation for Catalyst's production pathway to 200koz over the next three years.
Catalyst Three-Year Production and Cost Guidance
| Guidance
Range |
|
FY2025 |
FY2026 |
FY2027 |
|
|
Forecast |
Forecast |
Forecast |
| Production |
Koz |
105 – 120 |
140 – 165 |
180 – 200 |
| Indicated % of production target |
% |
94
% |
89
% |
88
% |
| AISC |
A$/oz |
$2,300 – $2,500 |
$2,100 – $2,300 |
$2,000 – $2,200 |
| Non-sustaining Operational Capital |
A$M |
32 |
15 |
10 |
| Total Growth
Capital |
A$M |
17 |
14 |
TBA* |
| Total Exploration Capital |
A$M |
>25 |
TBA* |
TBA* |
Table
1
:
Summary
of
mine
plan for
Catalyst
operations
| *Note: Exploration strategy evolving.
Excess cashflow will inform future spend |
Production Guidance Commentary
FY2025 :
Gold production in FY2025 is anticipated to be between 105koz to 120koz.
Production will be sourced from Plutonic Underground, Plutonic East and Henty mines.
K2 and Trident will be in the early stages of development with the refurbishment and establishment of the K2 underground, while it is planned for Trident's small open pit (or large box cut) to have commenced.
Exploration at in-mine proximal zones at Plutonic Underground will occur throughout the year with resulted reported intermittently.
Results of drill outs of the satellite deposit K2 and Plutonic East will also be reported throughout the year.
Exploration is planned along the Overthrust and Cinnamon corridors with wide spaced drilling aimed at generating new targets for follow up programs in either FY25 or FY26 (result dependent). A focus will be on constructing the exploration team and building the team's understanding of the Plutonic Belt's mineralisation.
FY2026 :
Gold production in FY2026 is anticipated to be between 145koz to 165koz.
Production will be sourced from each Plutonic Underground, Plutonic East, K2, Trident Open Pit and Henty. All Plutonic ores are to be processed through the existing and currently underutilised Plutonic Processing Plant.
It is planned that each of Plutonic Underground, Plutonic East, K2 and Henty operations will be running at steady state while Trident will be completing its open pit (large box cut) and transitioning to an underground operation. Ramp up to steady state operations at Trident is expected during the year.
Resource drill outs are expected to be completed during the year with a greater focus being placed on exploration.
The planned exploration program will be dependent on results received in FY25.
FY2027 :
Gold production in FY2027 is anticipated to be between 180koz to 220koz.
Production will be sourced from each Plutonic Underground, Plutonic East, K2, Trident Underground and Henty. All Plutonic ores are to be processed through the existing processing plant with the mill reach full capacity during the year.
Trident production will be a more meaningful contributor, but will be operating below peak production levels. While not planned, production at Plutonic Underground is expected to be increasingly sourced from new zones possibly leading to additional gold production at lower cost.
Increased contribution from Plutonic East, K2 and Trident is expected to contribute to lower AISC as the benefits of scale across Plutonic's largely fixed cost base are realised.
Project development and exploration will be dependent on previous years exploration results however it is anticipated the Trident underground will begin to convert the current 250koz Inferred Resource into Reserve. Similar extensions are also anticipated from Plutonic East and K2.
Cautionary Statement: The 2025 Production Target contains approximately 94% of Ore Reserves and Indicated Resources with the remainder in the Inferred Mineral Resource classification. There is a low level of geological confidence associated with Inferred Mineral Resource and there is no certainty that further exploration work will result in the conversion to Indicated Mineral Resource or that the Production Target itself will be realised.
Reserve Growth
Catalyst has grown Reserves in the last 12 months by 105%. Included in this is Plutonic Underground's Reserve growth of 52%. A summary of Catalyst's Reserve growth over the last 12-months is below.
In the same way Reserves have expanded at Plutonic, Catalyst targets expanding Reserves at these newly announced Reserves of Plutonic East, Trident and K2. Catalyst has committed A$18m to achieve this over FY25.
With the development plan now in place for each of these Reserves, a dedicated Resource drill out program is being implemented.
Catalyst is planning Resource drill out programs in four areas:
lutonic in-mine
Plutonic East
Trident
K2
Successful drilling results from these programs are expected to increase Reserves and extend the mine life at these deposits.
| Deposit |
Reserve as at 30
September 2023 |
Depletion |
Reserves at 30
September 2024 |
Reserve
growth (%) |
| Plutonic |
490 |
85 |
616 |
52
% |
| Trident |
- |
- |
188 |
- |
| Plutonic East |
- |
- |
36 |
- |
| K2 |
- |
- |
20 |
- |
| Henty |
115 |
25 |
154 |
71
% |
| Total |
605 |
110 |
1,015 |
105
% |
Table
2:
Summary
of
Reserve growth over 12 months
Plutonic In-Mine
Plutonic underground has been running, uninterrupted, for 30 years. Coming with this history is +40 years of historical drilling data. Catalyst has analysed this data and identified nine areas where historical data suggests Plutonic gold mineralisation extends.
A$9m has been allocated in FY25 to drilling out these areas to a 15 x 15m drill spacing for the purpose of delineating additional Reserves and generating near term production areas.
Zone F
The first area to be drilled is Zone F – see image 2 below.
The exploration target for this area is 30,000 to 45,000oz1. The cost to drill out this area to a 15m
x 15m spacing is A$1.5m.
Initial results have been positive and Catalyst believes it has delineated a new mining area. Such a positive response is a good result from testing the first of these nine areas.
The Exploration Target has been prepared and reported in accordance with the 2012 edition of the JORC Code. The potential quantity and grade of the Exploration Target is conceptual in nature. There has been insufficient exploration to estimate a Mineral Resource. It is uncertain if further exploration will result in the estimation of a Mineral Resource.
| _________________________________ |
| 1 The Exploration Target has been prepared and reported in accordance with the 2012 edition of the JORC Code. The potential quantity and grade of the Exploration Target is conceptual in nature. There has been insufficient exploration to estimate a Mineral Resource. It is uncertain if further exploration will result in the estimation of a Mineral Resource. |
Plutonic East
Plutonic East has a mine plan of three years producing an average of 16koz annually. It lies 2km from the underutilised Plutonic processing plant.
In order to better establish Plutonic East, Catalyst's intention is to drill out the deposit targeting a five year mine life averaging +20koz of gold annually. The cost to achieve this is A$5m.
K2
K2 has a mine plan of three years producing an average of 18koz annually. It lies 40km from the underutilised Plutonic processing plant with an existing, well maintained, haul road, connecting the two.
In order to better establish K2, Catalyst's intention is to drill out the deposit targeting a five-year mine life averaging +20koz of gold annually. The cost to achieve this is A$4m.
Trident
Trident has a plus five year mine plan producing an average of 37koz annually. It lies 2km from the
underutilised Plutonic processing plant.
Trident already has an established mine life of 5 years. Further extensions can come from the 250koz of inferred Resources that have not been converted into Reserve due to a lack of drill density.
It is Catalyst's intention is to drill out extensions to Trident to increase the mine life beyond what is currently known. This drilling has commenced at a cost of A$1.6m spent across five diamond holes.
Plutonic Underground Ore Reserves
An Ore Reserve Estimation is the economically mineable part of a Measured and/or Indicated Mineral Resource. It includes diluting materials and allowances for losses, which may occur when the material is mined or extracted.
Following is a summary of the Plutonic Underground Ore Reserves, as at 01 July 2024.
| Deposit |
Proved |
Probable |
Total |
| Tonnes
(Mt) |
Grade
(g/t Au) |
Gold
(koz) |
Tonnes
(Mt) |
Grade
(g/t Au) |
Gold
(koz) |
Tonnes
(Mt) |
Grade
(g/t Au) |
Gold
(koz) |
| Plutonic Underground |
- |
- |
- |
7,448 |
2.6 |
616 |
7,448 |
2.6 |
616 |
Table 3: Plutonic Underground Ore Reserves
| Notes: |
| 1. |
Ore Reserve estimated at 1.5g/t Au cut-off; |
| 2. |
Reserves are a combination of detailed mine design and Stope Optimised shapes. SO inputs include: Incremental Stoping and Grade Control Cost = AUD$59/t; Processing Costs = AUD$27.40/t ore; Site Administration Cost = AUD$16.70/t ore; Metallurgical Recovery = 86.5%; Royalties = 2.5%; Gold Price = AUD$2,700/oz; Minimum mining width = 3m. |
| 3. |
Mining dilution of 25% and ore recovery of 90% is applied. |
| 4. |
Numbers may not add up due to rounding |
Plutonic East Ore Reserves
An Ore Reserve Estimation is the economically mineable part of a Measured and/or Indicated Mineral Resource. It includes diluting materials and allowances for losses, which may occur when the material is mined or extracted.
Following is a summary of the Plutonic East Ore Reserves, as at 01 July 2024.
| Deposit |
Proved |
Probable |
Total |
| Tonnes
(Mt) |
Grade
(g/t Au) |
Gold
(koz) |
Tonnes
(Mt) |
Grade
(g/t Au) |
Gold
(koz) |
Tonnes
(Mt) |
Grade
(g/t Au) |
Gold
(koz) |
| Plutonic East Underground |
- |
- |
- |
456 |
2.5 |
36 |
456 |
2.5 |
36 |
Table 4: Plutonic East Ore Reserves
| Notes:
|
| 1. |
Ore Reserve estimated at 1.5g/t Au cut-off; |
| 2. |
Reserves are a combination of detailed mine design and Stope Optimised shapes. SO inputs include: Incremental Stoping and Grade Control Cost = AUD$59/t; Processing Costs = AUD$27.40/t ore; Site Administration Cost = AUD$16.70/t ore; Metallurgical Recovery = 84%; Royalties = 2.5%; Gold Price = AUD$2,700/oz; Minimum mining width = 3m, with a 0.5m dilution halo applied to Hangingwall and Footwall. |
| 3. |
Ore recovery of 90% is applied. |
| 4. |
Numbers may not add up due to rounding |
K2 Underground Ore Reserves
An Ore Reserve Estimation is the economically mineable part of a Measured and/or Indicated Mineral Resource. It includes diluting materials and allowances for losses, which may occur when the material is mined or extracted.
Following is a summary of the K2 Ore Reserves, as at 01 July 2024.
| Deposit |
Proved |
Probable |
Total |
| Tonnes
(Mt) |
Grade
(g/t Au) |
Gold
(koz) |
Tonnes
(Mt) |
Grade
(g/t Au) |
Gold
(koz) |
Tonnes
(Mt) |
Grade
(g/t Au) |
Gold
(koz) |
| K2 Underground |
- |
- |
- |
147 |
4.3 |
20 |
147 |
4.3 |
20 |
Table 5: K2 Underground Ore Reserves
| Notes: |
| 5. |
Ore Reserve estimated at 1.7g/t Au cut-off; |
| 6. |
Reserves are a combination of detailed mine design and Stope Optimised shapes. SO inputs include: Incremental Stoping and Grade Control Cost = AUD$70.80/t; Processing Costs = AUD$27.40/t ore; Site Administration Cost = AUD$16.70/t ore; Haulage Cost = AUD$12.0/t ore; Metallurgical Recovery = 91%; Royalties = 2.5%; Gold Price = AUD$2,700/oz; Minimum mining width = 2.75m, with a 0.5m dilution halo applied to Hangingwall and 0.25m dilution halo applied to Footwall. |
| 7. |
Ore recovery of 95% is applied. |
| 8. |
Numbers may not add up due to rounding |
Henty Underground Mineral Resource Estimate
Following is a summary of the Henty Underground Ore Reserves, as at 01 July 2024.
| Deposit |
Measured |
Indicated |
Inferred |
Total |
| Tonnes
(Mt) |
Grade
(g/t Au) |
Gold
(koz) |
Tonnes
(Mt) |
Grade
(g/t Au) |
Gold
(koz) |
Tonnes
(Mt) |
Grade
(g/t Au) |
Gold
(koz) |
Tonnes
(Mt) |
Grade
(g/t Au) |
Gold
(koz) |
| Henty Underground |
- |
- |
- |
3.7 |
3.5 |
410 |
0.6 |
2.9 |
52 |
4.2 |
3.4 |
462 |
Table 6: Henty Underground Mineral Resource Estimate
| Notes:
|
| 1. |
Mineral Resource estimated at 1.5g/t Au cut-off and reported within underground Shape Optimiser (SO). SO inputs include: Gold Price AUD$3,500/oz, Metallurgical Recovery = 92%; Royalties = 5.9%; Minimum mining width = 1.5m; Minimum stope height=16m, Minimum stope strike=5m |
| 2. |
Numbers may not add up due to rounding |
Henty Underground Ore Reserves
An Ore Reserve Estimation is the economically mineable part of a Measured and/or Indicated Mineral Resource. It includes diluting materials and allowances for losses, which may occur when the material is mined or extracted.
Following is a summary of the Henty Ore Reserves, as at 1 July 2024.
| Deposit |
Proved |
Probable |
Total |
| Tonnes
(Mt) |
Grade
(g/t Au) |
Gold
(koz) |
Tonnes
(Mt) |
Grade
(g/t Au) |
Gold
(koz) |
Tonnes
(Mt) |
Grade
(g/t Au) |
Gold
(koz) |
| Henty Underground |
- |
- |
- |
1,207 |
4.0 |
154 |
1,207 |
4.0 |
154 |
Table 7: Henty Underground Ore Reserves
| Notes: |
| 1. |
Ore Reserve estimated at 1.7g/t Au cut-off; |
| 2. |
Reserves are a combination of detailed mine design and Stope Optimised shapes. SO inputs include: Mining, Maintenance and Grade Control Cost = AUD$90/t; Processing Costs = AUD$28/t ore; Site Administration Cost = AUD$24/t ore; Metallurgical Recovery = variable, with average of 92.6%; Royalties = 5.9%; Gold Price = AUD$3,000/oz; Minimum mining width = 1.5m. |
| 3. |
Mining modifying factors are applied dependant on stope method, whereby 10-15% dilution is applied to the in-situ material, and ore recovery ranges from 92 - 95%. |
| 4. |
Numbers may not add up due to rounding |
Group Ore Reserves and Mineral Resources
Ore Reserves
| Ore Reserve |
Proved |
Probable |
Total |
| Tonnes
(kt) |
Grade
(g/t Au) |
Gold
(koz) |
Tonnes
(kt) |
Grade
(g/t Au) |
Gold
(koz) |
Tonnes
(kt) |
Grade
(g/t Au) |
Gold
(koz) |
|
| Plutonic Underground |
- |
- |
- |
7,448 |
2.6 |
616 |
7,448 |
2.6 |
616 |
|
| Plutonic East Underground |
- |
- |
- |
456 |
2.5 |
36 |
456 |
2.5 |
36 |
|
| Trident Underground |
- |
- |
- |
1,199 |
4.7 |
182 |
1,199 |
4.7 |
182 |
|
| Trident West Open Pit |
- |
- |
- |
144 |
1.4 |
6 |
144 |
1.4 |
6 |
|
| K2 Underground |
- |
- |
- |
147 |
4.3 |
20 |
147 |
4.3 |
20 |
|
| Henty Underground |
- |
- |
- |
1,207 |
4.0 |
154 |
1,207 |
4.0 |
154 |
|
| Group Total |
- |
- |
- |
10,601 |
3.0 |
1,015 |
10,601 |
3.0 |
1,015 |
|
Mineral Resources
| Mineral Resource |
Measured |
Indicated |
Inferred |
Total |
| Tonnes
(Mt) |
Grade
(g/t Au) |
Gold
(koz) |
Tonnes
(Mt) |
Grade
(g/t Au) |
Gold
(koz) |
Tonnes
(Mt) |
Grade
(g/t Au) |
Gold
(koz) |
Tonnes
(Mt) |
Grade
(g/t Au) |
Gold
(koz) |
| Plutonic Underground |
- |
- |
- |
17.2 |
2.9 |
1,592 |
0.7 |
2.6 |
62 |
17.9 |
2.9 |
1,654 |
| Trident Underground |
- |
- |
- |
1.6 |
5 |
257 |
2.6 |
3 |
251 |
4.2 |
3.7 |
508 |
| Trident Open Pit |
- |
- |
- |
0.4 |
1.6 |
16 |
- |
- |
- |
0.4 |
1.6 |
16 |
| K2 Underground |
- |
- |
- |
0.2 |
4.2 |
31 |
0.5 |
3.4 |
49 |
0.7 |
3.6 |
81 |
| Plutonic East Underground |
- |
- |
- |
0.9 |
2.8 |
80 |
1.3 |
2.4 |
102 |
2.2 |
2.5 |
182 |
| Triple-P & Zone-B UG |
- |
- |
- |
- |
- |
- |
0.2 |
4.3 |
24 |
0.2 |
4.3 |
24 |
| Trident West Open Pit |
- |
- |
- |
0.3 |
1.1 |
9 |
- |
- |
- |
0.3 |
1.1 |
9 |
| Marwest & Mars Open Pit |
- |
- |
- |
0.7 |
2 |
45 |
- |
- |
- |
0.7 |
2 |
45 |
| Mareast Open Pit |
- |
- |
- |
0.5 |
1.9 |
30 |
- |
- |
- |
0.5 |
1.9 |
30 |
| EastMareast Open Pit |
- |
- |
- |
0.2 |
1.1 |
8 |
- |
- |
- |
0.2 |
1.1 |
8 |
| Wedgetail Open Pit |
- |
- |
- |
0.2 |
1.7 |
10 |
- |
- |
- |
0.2 |
1.7 |
10 |
| PHB-1 (K3) Open Pit |
- |
- |
- |
0.6 |
2 |
39 |
0.2 |
1.4 |
11 |
0.8 |
1.9 |
50 |
| K1 Open Pit |
- |
- |
- |
0.7 |
1.8 |
42 |
0.8 |
1.7 |
47 |
1.6 |
1.8 |
89 |
| Triple-P & Triple-P Sth OP |
- |
- |
- |
0.6 |
2.1 |
42 |
0.5 |
1.4 |
21 |
1.1 |
1.8 |
63 |
| Albatross & Flamingo OP |
- |
- |
- |
- |
- |
- |
0.9 |
1.4 |
38 |
0.9 |
1.4 |
38 |
| Cinnamon Open Pit |
- |
- |
- |
1.5 |
1.8 |
86 |
0.5 |
1.9 |
32 |
2 |
1.8 |
119 |
| Total Plutonic and Marymia |
- |
- |
- |
25.6 |
2.8 |
2,287 |
8.2 |
2.4 |
637 |
33.9 |
2.7 |
2,926 |
| Henty Underground |
- |
- |
- |
3.7 |
3.5 |
410 |
0.6 |
2.9 |
52 |
4.2 |
3.4 |
462 |
| Total Henty |
- |
- |
- |
3.7 |
3.5 |
410 |
0.6 |
2.9 |
52 |
4.2 |
3.4 |
462 |
| Boyd's Dam |
- |
- |
- |
0.5 |
5 |
73 |
0.1 |
5 |
20 |
0.6 |
5 |
93 |
| Iris Zone |
- |
- |
- |
- |
- |
- |
0.1 |
26.2 |
70 |
0.1 |
6 |
70 |
| Total Bendigo |
- |
- |
- |
0.5 |
5 |
73 |
0.2 |
13.3 |
90 |
0.7 |
7.7 |
163 |
| Group Total |
- |
- |
- |
30 |
2.9 |
2,770 |
9 |
2.7 |
779 |
39 |
2.8 |
3,551 |
| Material information summary as required under
ASX Listing Rule 5.16 and 5.17. |
HENTY GOLD MINE, TASMANIA
Mining
Henty has been in operation for 28 years, whereby various mining methods have been used in the past (room and pillar, longhole open stoping with paste fill/ rock fill or no fill).
The mining method used for the OREplan is a combination of longhole stoping and benching.
Stope designs assume a minimum mining width of 1.5m, minimum stope length of 10m and stope height to a maximum of 15m. The intervals vary from 12-15m, which is deemed an appropriate method for control of dilution, reduction of pillars and ore loss, ground control, safety and regional stability.
Dilution of 15% is applied to the in-situ stope ore tonnes and the ore recovery of 92-95% is applied, depending on extraction method.
Unclassified and inferred material have not been included within the Ore Reserves, however if the material is mined as a consequence to mining an Ore Reserve stope, then material had a zero-grade assigned and was therefore treated as dilution waste.
Processing
Henty's process plant has an annual plant capacity of 300,000 tonnes and comprises a semi-autogenous mill (SAG) feeding a conventional carbon-in-leach (CIP) circuit. Catalyst has operated the plant since January 2021. Feed grade during that time has been 3.5-4.0g/t.
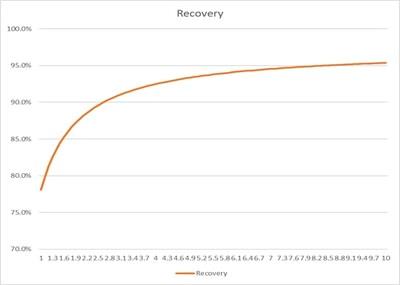
The 92% recovery used in the ORE plan is consistent with current plant recoveries and there is no foreseeable reason to change to projected recovery.
Economic assumptions
Mine operating costs (including mining, development, maintenance and grade control drilling) have been based on recent operating history and estimated mining physicals. Costing for sustaining capital items have been based off recent history, vendor quotes or management estimates.
Operating costs for the processing plant have been estimated using recent operating history and estimated physicals.
Other operating costs including power and administration have been estimated using recent operating history.
Royalties are based on existing royalties with the Tasmanian government and third parties.
PLUTONIC UNDERGROUND DEPOSIT, PLUTONIC GOLD BELT, WA
Mining
Plutonic Underground has been in operation for 28 years, whereby various mining methods have been used in the past (room and pillar, longhole open stoping with paste fill/ rock fill or no fill).
The mining method used for the ORE is longhole stoping.
Stope designs assume a minimum mining width of 3.0m, minimum stope length of 5m and stope height of 5-25m. For stope tonnes dilution of 25% is applied to the in-situ designs and stope ore recovery of 90% is applied.
Processing
The metallurgical characteristics of the Plutonic are well known, simple and are applicable to feed through Plutonic Processing "Carbon in Leach circuit" Plant.
The process plant consists of an open circuit jaw crusher, coarse ore stockpile, semi-autogenous grinding mill and ball mills, two leach tanks, and six carbon adsorption tanks.
Plant performance for the past five years indicates reasonable performance, with recoveries ranging from 76% to 90%, and an average recovery in 2024 of 86.5%. Metallurgical recoveries used in the ORE were based on site production data and detailed metallurgical testing to an appropriate standard.
Economic assumptions
Mine operating costs (including mining, development, maintenance and grade control drilling) have been based on recent operating history at the Plutonic Gold Mine and estimated mining physicals.
Costing for sustaining capital items have been based off recent history, vendor quotes or management estimates.
Operating costs for the processing plant have been estimated using recent operating history
Other operating costs including power, administration, camp services and flights have been estimated using recent operating history.
Royalties are based on existing royalties with the Western Australian government.
PLUTONIC EAST DEPOSIT, PLUTONIC GOLD BELT, WA
Mining
Plutonic East underground operated from 2001 until 2012 with production of 812kt's @ 5.3g/t for 137.3koz.
The mining method assumed for Plutonic East is long-hole 'flat to sub vertical'
stoping, the mining method previously applied at Plutonic East Underground. If a stope can be backfilled with waste rock, it will be filled.
Plutonic East was in operation from 2001 to 2012 whereby flat to sub vertical bench stopes were extracted successfully along strike of the ore system. A small percentage of the stopes were waste loose backfilled to provide overlying access and/or passive hangingwall support. The historic voids have been incorporated into the MRE, with an additional 2.5m depletion skin around the stope voids incorporated into the MRE.
SO input parameters include a 1.5 g/t Au cut-off, minimum mining width 3m, minimum stope length of 5m, stope height of 5-25m and a gold price of A$$2,700/oz.
Processing
The metallurgical characteristics of Plutonic East are well known, having been previously operated as an underground mine.
Catalyst proposes to process Plutonic East through the Plutonic processing plant.
A metallurgical recovery of 84% was used in the COG for Plutonic East.
Economic assumptions
Catalyst plans to mine the Plutonic East deposit on an owner-operator basis. Given the similarities in operational framework between the existing Plutonic operations and Plutonic East, Plutonic's historical mining costs have been used as an input to the mining cost estimate. Plutonic East's proximity to Plutonic allows many synergies, including existing infrastructure, an existing employee pool, and systems and structures in place to run an underground mining operation.
Plutonic East ore will be processed at the Plutonic processing plant.
Operating costs for the processing plant have been estimated using recent operating history.
Other operating costs including power and administration have been estimated using recent operating history at the Plutonic Gold Mine.
Royalties are based on existing royalties with the Western Australian government.
K2 DEPOSIT, PLUTONIC GOLD BELT, WA
Mining
K2 underground operated from 1997 to 1998, with only the portal and decline developed. The Marymia Operation (including the K2 underground) was placed under Care and Maintenance in mid-1998 because of a depressed gold price environment.
The overlying open pit was mined in 1992 to 1995 with a production of 966kt's @ 4.0g/t for 116koz.
Proposed mining practices for K2 are based on the current operational practises of the neighbouring Plutonic underground mine as well as reflecting the historical mining methods proposed for K2.
K2 was in operation from 1997-1998 whereby narrow up hole stopes were planned to be extracted along strike of the ore system. Previous technical studies and assessments have demonstrated that the proposed mining methods are technically achievable and are economically viable.
SO input parameters include a 1.7 g/t Au cut-off, minimum mining width 2.75m, minimum stope length of 8m, stope height of 17m and a gold price of A$$2,700/oz.
The orientation of SO's is variable depending on the geometry of the mineralisation
Environmental, social and other factors have been considered internally.
Processing
The metallurgical characteristics of K2 are well known, with a number of feasibility studies having been completed in the past.
Catalyst proposes to process K2 through the Plutonic processing plant.
K2 was historically processed at the now decommissioned Marymia Process Plant. Historical records and recent test works have indicated a 91% average recovery.
Economic assumptions
Catalyst plans to mine the K2 deposit on an owner-operator basis. Given the similarities in operational framework between the existing Plutonic operations and K2, Plutonic's historical mining costs have been used as an input to the mining cost estimate. K2's proximity to Plutonic allows many synergies, including existing infrastructure, an existing employee pool, and systems and structures in place to run an underground mining operation.
K2 ore will be processed at the Plutonic processing plant.
Operating costs for the processing plant have been estimated using recent operating history
Other operating costs including power and administration have been estimated using recent operating history at the Plutonic Gold Mine.
Royalties are based on existing royalties with the Western Australian government and third parties.
TRIDENT DEPOSIT, PLUTONIC GOLD BELT, WA
Refer to Catalyst Metals Limited's ASX announcement on 3 July 2024 – Trident Maiden Reserve Underpins New Low-Cost Development.
ZONE F EXPLORATION TARGET
Exploration targets for Plutonic Main were generated as follows:
Each exploration area used an adjacent portion (with similar scale extents) of the 2023 Plutonic MRE as a proxy for total mineralization endowment.
As Plutonic is a stacked lode system, each proxy area was then reported as a grade tonnage curve for indicated and inferred material over a given volume of mine mafic (being the host lithology).
Each proxy grade tonnage curve was then volume corrected against the volume of mine mafic in the relevant target area.
A confidence factor was then applied to each target area relative to its proxy, this ranged between 50 and 75% of the initial target grade tonnage curve. This factor allows for a possible decrease in mineralisation intensity and also takes into consideration the relative level of geological and volume uncertainty related to the mine mafic host lithology.
A second correction factor was applied to account for conversion into eventual mining inventory, this was 60% of the outcome of the previous calculation. This represents an estimated Reserve conversion factor for virgin areas. It is a higher factor than the average for Plutonic, however the majority of Plutonic Reserves are in remnant areas which have a lower conversion factor.
All exploration targets use a nominal 1.5 g/t cutoff grade.
The Exploration Target has been prepared and reported in accordance with the 2012 edition of the JORC Code. The potential quantity and grade of the Exploration Target is conceptual in nature. There has been insufficient exploration to estimate a Mineral Resource. It is uncertain if further exploration will result in the estimation of a Mineral Resource.
The following ranges are considered appropriate for the exploration target for Zone F :
Ounces: 30 – 45koz
Tonnes: 350 kt – 430 kt
Grade: 2.7 – 3.2
| Material information summary as required under ASX Listing Rule 5.9. |
ORE RESERVE ESTIMATES (Plutonic)
1.
Level of Study
The Ore Reserve has been determined based on the current operational practises of the Plutonic underground mine. Plutonic has been in production as an underground operation since 1995.
The level of accuracy of the of the mine plan is technically achievable and operationally executable.
2.
Classifica ti on
A 'Probable Ore Reserve' is the economically mineable portion of an Indicated Mineral Resource.
The Ore Reserves classification reflects the Competent Person's view of the deposit. Only Probable reserves have been declared and are based on Indicated Resources following consideration of modifying factors. No probable Ore Reserves are derived from Measured Resources, as there was no Measured Resource within the MRE. There is a high level of confidence in the modifying factors applied because they based on 'actual'
operating performance currently being achieved at the Plutonic mine.
3.
Mining Method
Previous operational performance has demonstrated that the current mining method of Long Hole Open Stope is technically achievable and is economically viable.
The historic voids have been incorporated into the Mineral Resource Estimate and coded to ensure the method of fill determines proximity of stope shape generation.
Unclassified and inferred material have not been included within the Ore Reserves, however if the material is mined as a consequence to mining an Ore Reserve estimated stope, then material had a zero grade assigned and was therefore treated as waste.
The mining modifying factors used in the Ore Reserves calculations are based on historically achieved Mining Dilution (25%) and Recovery (90%) factors. The current mine plan ethos and mining method will continue for mining of Ore Reserves.
4.
Processing
The metallurgical characteristics of the Plutonic are well known, simple and are applicable to feed through Plutonic Processing "Carbon in Leach circuit" Plant.
The process plant ("PP1") consists of an open circuit jaw crusher, coarse ore stockpile, semi-autogenous grinding ("SAG") mill and ball mills, two leach tanks, and six carbon adsorption tanks. A three-stage hard rock crushing circuit was incorporated in 1994 which included a fine ore bin and an additional ball mill. Plant performance for the past five years indicates reasonable performance, with recoveries ranging from 76% to 90%, and an average recovery in 2024 of 86.5%. Metallurgical recoveries used to generate the Ore Reserves were based on site production data and detailed metallurgical testing to an appropriate standard.
5.
Cut-off Grade
The cut-off grade applied to the Ore Reserve estimate is defined as the $A value per tonne of ore after consideration of all costs (mining, processing, Site administration), metallurgical recoveries,transport costs and royalties.
Stope optimiser shapes were initially categorised by using the operating cut-off grade (1.5g/t). Subsequently, stope shapes that were spatially distant from the mine's footprint were deleted to filter inventory requiring excessive development costs to access.
Development material was considered in the Ore Reserve estimate if the material could cover the cost of haulage and processing (1.0g/t).
Inputs into the cut-off grade calculation include: Incremental Stoping and Grade Control Cost = AUD$59/t, Processing Costs = AUD$27.40/t ore, Site Administration Cost = AUD$16.70/t ore, Metallurgical Recovery = 86.5% (average across all mining units), Royalties = 2.5% and utilised a Gold Price = AUD$2,700/oz.
6.
Estimation Methodology
The Ore Reserves estimate is reported within an underground Shape Optimiser (SO) evaluation from the July 2024 depleted MRE model.
SO input parameters include a 1.5 g/t Au cut-off, minimum mining width 3m, minimum stope length of 5m, stope height of 5-25m and a gold price of A$$2,700/oz.
The orientation of SO's is variable depending on the geometry of the mineralisation.
Plutonic has been in operation for 28 years, whereby various mining methods have been used in the past (room and pillar, LHOS with paste fill/ rock fill or no fill) The historic voids have been incorporated into the MRE and coded to ensure the method of fill determines proximity of stope shape generation. Unclassified and Inferred material have not been included within the Ore Reserves, however if the material is mined as a consequence to mining an Ore Reserve estimated stope, then material had a zero grade assigned and was therefore treated as waste.
7.
Other Material Factors, Approvals and Infrastructure
Activities undertaken onsite are undertaken in accordance with the environmental approvals. Monitoring programs are conducted to ensure that key approval and licence requirements are complied with. Mining tenements and approvals are in good standing. The Company has demonstrated a strong environmental and social performance, there are no identified threats that place the companies social licence to operate at risk.
The Plutonic Gold Mine is a well-established mine which has services and infrastructure consistent with an isolated area operating mine. The existing site infrastructure can support the mine plans as historically the site has successfully operated at production rates significantly higher than those envisaged within the Ore Reserves Plan.
ORE RESERVE ESTIMATES (Henty)
1.
Level of Study
The declaration
of Henty Ore Reserve Estimation is based on the Company's internal studies which demonstrate continued economic viability of the currently operating Henty mine. The level of accuracy of the of the mine plan is technically achievable and operationally executable.
2.
Classifica ti on
A 'Probable Ore Reserve' is the economically mineable portion of an Indicated Mineral Resource.
The Ore Reserves classification reflects the Competent Person's view of the deposit. Only Probable reserves have been declared and are based on Indicated Resources following consideration of modifying factors. No probable Ore Reserves are derived from Measured Resources, as there was no Measured Resource within the MRE. There is a high level of confidence in the modifying factors applied because they based on 'actual'
operating performance currently being achieved at the Plutonic mine.
3.
Mining Method
Henty has been in operation for 28 years, whereby various mining methods have been used in the past (room and pillar, LHOS with paste fill/ rock fill or no fill) The historic voids have been incorporated into the MRE and coded to ensure the method of fill determines proximity of stope shape generation. The mining method used for the Reserve is a combination of Longhole Stoping and Benching.
Dilution of 15% is applied to the in-situ stope ore tonnes and the ore recovery of 92-95% is applied, depending on extraction method.
Waste development has a 15% dilution factor applied; however Ore development had no dilution applied. Development has 100% mining recovery applied.
Majority of the stopes will be filled using unconsolidated rock fill trucked from surface or underground development waste. This will improve stope stability and increase ore recovery while minimising the backfill costs. Stopes will be filled with waste rock from development where possible to minimise the trucking requirements.
4.
Processing
The Henty Gold Mine has been operational since 1996. The process plant has an annual plant capacity of 300,000 tonnes and comprises a semi-autogenous mill (SAG) feeding a conventional carbon-in-leach (CIP) circuit. Catalyst has operated the plant since January 2021. Feed grade during that time has been 3.5-4.0g/t. The 94% recovery used in the ORE estimation is consistent with current plant recoveries and there is no foreseeable reason to change to projected recovery.
5.
Cut-off Grade
Stope optimiser shapes were initially categorised by using the operating cut-off grade (1.7g/t). Subsequently, stope shapes that were spatially distant from the mine's footprint were deleted to filter inventory requiring excessive development costs to access.
Operating cut-off grades applied to the Ore Reserve Estimate were 1.7g/t for stope shapes (after all forms of dilution and ore loss) and 1.0g/t for ore development shapes (after applying development profiles to the ore boundary).
Cost and modifying factors used to determine the above COG's were direct underground operating (mining and geology) A$ 90/ore t, processing A$ 28/ore t, site G&A A$24/ore t, metallurgical recovery 92.0%, royalties 5.9% NSR (variable using grade recovery curve) and gold price of A$3,000/oz.
6.
Estimation Methodology
The Ore Reserves estimate is reported within an underground Shape Optimiser (SO) evaluation from the depleted resource model.
SO input parameters include a 1.7 g/t Au cut-off, Gold price of AUD$3,000/oz, minimum mining width of 1.5m, minimum stope length of 10m. Control strings have been used to control stope height to a maximum of 15m. The intervals vary from 12-15m, which is deemed an appropriate method for control of dilution, reduction of pillars and ore loss, ground control, safety and regional stability.
Stable stope dimensions using a maximum HR=4m have been based on geotechnical assessment.
The orientation of the SO's is variable depending on the geometry of the minerialisation.
7.
Other Material Factors, Approvals and Infrastructure
Activities undertaken onsite are undertaken in accordance with the environmental approvals. Monitoring programs are conducted to ensure that key approval and licence requirements are complied with. The Company has demonstrated a strong environmental and social performance, there are no identified threats that place the companies social licence to operate at risk.
All Henty Mine infrastructure is in place.
The Henty TSF is approved for a further 6m height lift which will allow production through to 2030.
MINERAL RESOURCE ESTIMATE (Henty)
Material information summary as required under ASX Listing Rule 5.8 and JORC Code (2012) reporting guidelines.
1.
Mineral Resource Statement
The Mineral Resource Statement for the Henty Gold Mine Mineral Resource estimate was prepared during April 2024 and is reported according to the Australasian Code for Reporting of Exploration Results, Mineral Resources and Ore Reserves (the 'JORC Code') 2012 edition.
The Mineral Resource estimate includes 57,606m of drilling from 5025 diamond drill holes (DD), 5116 Face Samples and 1141 Sludge holes completed since 1996. The depth from surface to the current vertical limit of the Mineral Resources is approximately 935 m (1650 mRL).
In the opinion of Catalyst, the resource evaluation reported herein is a reasonable representation of the global gold Mineral Resources within the Henty Gold Mine deposit, based on sampling data from Diamond drilling Sludge holes and Channel Samples available as of 28 January 2024. Mineral Resources are reported below topography and are comprised of fresh rock only.
The Henty Gold Mine March 2024 Mineral Resource Estimate (MRE) has been undertaken with a focus on delineating areas of the MRE with Reasonable Prospects for Eventual Economic Extraction (RPEEE) by underground mining methods.
The MRE has been constrained within an underground Shape Optimiser (SO) evaluation from the depleted resource model.
SO input parameters include a 1.5 g/t Au cut-off, minimum mining width of 1.5m minimum stope length of 5m, stope height of 16m.
The orientation of SO's is variable depending on the geometry of the mineralisation.
The entire MRE consists of Indicated and Inferred Mineral Resources. No Measured Mineral Resources have been reported at this stage of the project.
The Mineral Resource Statement is presented in Table 1.
Table 1:
Henty Gold Mine March 2024 MRE (at 1.5 g/t Au cut-off)
| Classification |
Tonnes Mt) |
Au g/t |
Ounces (kOz) |
| Indicated |
3.69 |
3.5 |
410.4 |
| Inferred |
0.55 |
2.9 |
52.3 |
| Total |
4.24 |
3.4 |
462.4 |
| Notes: |
| 1. |
Mineral Resource estimated at 1.5g/t Au cut-off and reported within underground Shape Optimiser (SO). SO inputs include: |
|
Gold Price AUD$3,500/oz, Metallurgical Recovery = 92%; Royalties = 5.9%; Minimum mining width = 1.5m; Minimum stope height=16m, Minimum stope strike=5m |
| 2. |
Numbers may not add up due to rounding |
A total of 881,623 m of drilling from 6,756 diamond drill holes, 1,452 sludge holes and 5,822 channel samples were available for the Mineral Resource estimate. Mineralisation interpretations were informed by diamond, sludge and channel samples (14,030 holes, of which 11,282 intersect the resource) for 57,606 m of drilling intersecting the resource.
2.
Competent Person's Statement
The information in the report to which this Mineral Resource Statement is attached that relates to the estimation and reporting of gold Mineral Resources at the Henty Gold Mine deposit is based on information compiled by Mr Andrew Finch,
BSc, a Competent Person who is a current Member of Australian Institute of Geoscientists (MAIG 3827). Mr Finch, Geology Manager, at Catalyst Metals Ltd has sufficient experience relevant to the style of mineralisation and deposit type under consideration and to the activities being undertaken to qualify as a Competent Person as defined in the 2012 Edition of the Australasian Code for Reporting of Exploration Results, Mineral Resources and Ore Reserves. Mr Finch consents to the inclusion in the report of matters based on his information in the form and context in which it appears.
3.
Drilling Techniques
Sampling data for the Henty Gold Mine MRE includes diamond drilling (DD), face channel sampling (CH) and sludge sampling (SL) techniques.
The sampling database has been compiled from information collected when the Project was under ownership of numerous companies including (listed from most recent):
Catalyst Metals (2021 to current)
Diversified Minerals (2016 to 2020)
Unity Mining (2009 to 2016)
Barrick Gold (2006 to 2009)
Placer Dome (2003 to 2006)
Aurion Gold (2001 to 2003)
RGC/Goldfields (1996 to 2001).
For the most recent drilling completed by Catalyst, DD
collar positions are set out by Mine Surveyors. The drilling crew has an azi-reader device that enables them to set up at the correct azimuth and dip according to the drillhole plan. Final collar positions are then picked up by Mine Surveyors at hole completion. For downhole surveys taken up to January 2019, a Devi-flex tool was used, with surveys taken every few metres. From January 2019 onwards, a downhole Gyroscopic tool was employed.
For underground workings, development drives are regularly picked up by Mine Surveyors. At stope completion, a cavity monitoring system is generally used to model the final voids.
The location of face channel samples is determined by measuring the distance from the closest survey station. The face channel is treated as a short drillhole, with collar and survey information stored in the site database.
All reported coordinates are referenced to the grid system Geocentric Datum of Australia 1994 (GDA94).
Underground mobile DD drill rigs are utilised to produce either LTK60 or NQ2 size core. Drill core is not routinely oriented.
4.
Historical Drilling
Details
relating to
geospatial
location protocols
for
drilling earlier than 2009
are
unavailable;
however, Catalyst considers that it is reasonable to assume that industry standard techniques were employed.
5.
Sampling and Sub-Sampling Techniques
For drillhole data, either whole core or half core is submitted for analysis. In areas where infill drilling
is
required, whole
core
may
be
submitted
given
that
there
are
other
holes
available with
half
core
for future reference. Sample recovery is recorded for DD core samples as part of geotechnical logging
Samples are taken at 0.2–1.2
m intervals and honour lithological boundaries, with intervals entered in the same spreadsheet that is used for logging. Core is cut with an automatic core saw. Samples are placed in calico bags and then into polyweave bags for transport to the laboratory. Certified reference materials (CRMs) and blank material are inserted in the sample stream to monitor analytical bias and carry-over contamination, respectively.
For underground workings, face channel sampling is carried out at grade height (~1.5
m). A duplicate sample is taken
on
all
faces
to
monitor sample
precision.
Samples are
taken
at
0.2–1.2
m
intervals
and
honour
different rock types, alteration zones, and mineralised zones. CRMs and blank material are inserted in the sample stream to monitor analytical bias and carry-over contamination, respectively.
Samples are placed in an oven on site after the geologist returns from underground. The primary laboratory (ALS in Burnie) collects the samples each morning and generally provides results later that day, giving a 24–36-hour sample turnaround.
Sludge holes are drilled at Henty in areas where additional grade control data is needed to confirm grades adjacent to existing development.
Sludge holes are drilled with underground production rigs, with samples collected by operators for each drill rod from drill return fines, and holes flushed between samples.
Sludge hole collar positions are marked out by site surveyors and picked up once holes are completed, with hole dip and azimuth not measured and taken from design documents.
Sludge samples are processed at the Burnie ALS laboratory using fire assay, with crushed rock standard and blank material is submitted with each sludge sample batch.
6.
Historical Sampling
Details relating to drilling techniques, quality assurance (QA) protocols and quality control (QC) results for data
gathered
prior
to
2009
is
largely unavailable. However, the information provided indicates that sampling techniques and sample preparation were broadly similar to that of the current drilling techniques. QA protocols were employed, in some form, for the analytical data gathered during this period.
7.
Sample Analysis Method
Historical information provided indicates that several analytical laboratories have been used over the history of the Project, and analytical methodologies have varied slightly over time. Typically fire assay with determination by atomic absorption spectrometry (AAS) has been used.
Currently all samples are submitted to ALS Burnie for gold analysis. Samples are crushed and pulverised prior to selection of a 30 g subsample for fire assay with determination by AAS.
Occasionally, bismuth, silver, copper, lead, zinc, arsenic and molybdenum analyses are completed to assist with understanding the nature of the mineralisation and for metallurgical assessment. Copper, for example, may consume cyanide during processing. If required, pulps are sent from Burnie to ALS Townsville for multi- element determination.
In 2020, CSA Global completed a detailed review of the QC data for the period 2016 to 2020 and the analytical results were considered as being acceptable to support the MRE.
Catalyst submitted a total of 1,856 blank samples between January 2021 and December 2022 and 99% of the blank results were within acceptable limits. Fifteen blank failures (1%) were recorded during the period. The batches with failed blanks were re-assayed. This is not considered as presenting a material issue to the MRE.
Catalyst submitted a total of 2,234 standards between January 2021 and December 2022. A total of eight different types of CRMs were submitted to the laboratory and a new CRM; OREAS 251b was introduced in December 2022. CSA Global reviewed the results
of
CRM submissions and concluded that the
submitted
CRMs
performed
within acceptable
limits.
Although sample collection, sample preparation, sample logging and analytical techniques have varied over the Project's history, all can be considered as industry standard at the time. The amount of QC data that was collected has also varied over the Project's history, but overall is considered as being acceptable to support the MRE.
8.
Geology and Geological Interpretation
The Henty deposit lies within the Mount Read Volcanic (MRV) Belt in western Tasmania. The most important metallogenic event in Tasmania coincided with the deposition of the MRV, which occurred from the early
middle Cambrian to the early late Cambrian. The
main mineralised belt of the
MRV between
Mount
Darwin
and
Hellyer
is
the
Central Volcanic
Complex
(CVC). The
CVC
is
dominated
by
proximal volcanic
rocks
(rhyolite and
dacite
flows, domes
and
cryptodomes
and
massive
pumice breccias)
and
andesite and rare basalt (lavas, hyaloclastites, and intrusive rocks) deposited in a marine environment.
The Cambrian Tyndall Group Comstock Formation hosts much of the mineralisation at the Henty deposit. A unit of quartz-bearing volcaniclastic sandstone and conglomerate of mixed felsic and andesitic provenance, with the latter common towards the base, and minor felsic and andesitic lavas and intrusive rocks and welded ignimbrite.
The Henty Gold Mine consists of a series of small high-grade lenses of gold mineralisation in quartz-sericite altered volcaniclastic and volcanic rocks that occupy a large sub-vertical quartz-sericite alteration zone.
There are three main alteration assemblages intimately associated with the gold mineralisation as follows:
MV alteration assemblage:
Sulphide-poor, quartz+sericite alteration facies ("MV") is distinguished by pale green sericite concentrated in cleavage planes that envelop domains of intense silicification. The boundaries between sulphide-rich domains ("MZ") and MV domains are typically very sharp. MV contains minor chalcopyrite and galena, as small coarse-grained concentrations in siliceous domains, with sparse sphalerite and pyrite. Purple fluorite occurs in places.
MQ alteration assemblage:
High gold grades are most commonly hosted in an intense
silicification alteration facies ("MQ"). The MQ-style alteration is generally 5–50 m stratigraphically below the base of the Lynchford Tuff and generally shows a close spatial association with MV alteration. Boundaries between MV and MQ altered rocks are sharp. The MQ has been repeatedly fractured and annealed, with multiple generations of fine veinlets of quartz, sulphide and calcite, in contrast to the adjacent sericite-rich MV which behaved in a ductile manner during deformation. The distinguishing feature of the MQ is that all feldspars and sheet silicates are replaced by quartz. Late irregular fractures within the MQ contain free gold, together with pyrite, chalcopyrite, galena, and minor tellurides and bismuth sulphosalts.
MZ alteration assemblage:
Within the
footwall of the massive pyrite horizon, the host rocks are altered to a quartz+sericite+pyrite assemblage with disseminated base metal sulphides ("MZ"). This assemblage commonly has an apparent fragmental texture and is best developed in coarse volcaniclastic rocks. Sulphide content is relatively high, averaging ~5%, with typically 0.1–1 ppm Au. The appearance of base metal sulphides is usually a visual indicator of anomalous gold grades.
A total of 881,623 m of sampling from 6,756 diamond drill holes, 1,452 sludge holes and 5,822 channel samples were available for the Mineral Resource estimate
and supported by a nominal drill density of 10 x15m along strike.
The Henty
deposit comprises 12 individual model areas all of which have been updated in this MRE (Cradle
Zone,
Darwin
Central, Darwin
North,
Darwin South,
Intermediate
Zone, Newton-Mount Julia, Read
Zone,
Sill
Zone,
Tear
Away
Zone, Tyndall Zone,
Zone
15 and
Zone
96).
Gold mineralisation domains were interpreted primarily on geological logging, face channel sampling and geological mapping of underground exposures, based on lithology, grade distribution, major faults and geometry.
Interpretations of domain continuity were undertaken in Datamine software using all available drillholes, face channel samples and sludge holes.
Interpretation of each ore domain was constrained by a combination of gold grades (nominally 0.5-1 g/t ) and lithology, with individual lenses generally conforming to a particular style of alteration.
The domains to the north of the Moa fault steeply dip to the west with a thickness of 1-8
m and run semi-parallel to the NNE striking Henty Fault; south of the Moa fault the domains trend from NNE to NE. The mineralisation extends over a strike length (North – South) of approximately 3200
m and currently extends to a depth of approximately 850
m below surface.
Drillhole data spacing varies somewhat over the deposit area. Density of drilling is selected to match the complexity of mineralisation, which is recognised as varying between different domains. Most deposits are drilled out at 10–15 m spacings (along strike and down dip).
Drillholes are clustered in some areas, and often become more widely spaced at the edges of the deposits or in areas where the mineralisation is low tenor and delineation of economic material is unlikely.
For underground workings face channel sampling is carried out at grade height (~1.5 m) along ore development drives prior to stoping. Approximately every second cut (or ~6.0 m strike length) is generally sampled, however, this does not always occur.
CYL considers confidence in mineralisation continuity and distribution, as implied within the Mineral Resource estimate classification of Indicated and Inferred, is moderate, given the drill spacing described above and the patchy nature of mineralisation at Henty.
9.
Estimation Methodology
The majority of mineralisation domains used in the MRE were manually constructed in Datamine software. The Z96 geological was constructed using LeapFrog software. Block modelling and grade interpolation were carried out using Surpac software. Statistical analysis was carried out using Snowden Supervisor software.
Block model constraints were created by applying the interpreted mineralised domain wireframes. Sub-celling in all domains was 0.625
m x 0.625
m x 0.625
m to accurately reflect the volumes of the interpreted wireframes.
All drillhole assay samples were uniquely flagged according to the mineralisation domains.
All drillholes are composited to 1m downhole using a best-fit methodology and
0.5 m minimum threshold on inclusions.
All DD, CH and SL samples were composited to 1m downhole using a best-fit methodology and
0.5 m minimum threshold on inclusions. A small of residual composites were retained in the estimation.
Henty gold mineralisation is hosted in multiple sub-parallel and sub-vertical tabular lenses ranging in strike length from a few tens of meters up to nearly 800m in length. The vertical extent of individual lenses can range from a few tens of meters to 270m vertically.
The true width of the lenses ranges from 0.5m to >10m.
The Henty March 2024 MRE incorporates the estimation of fifty-five individual mineralised lenses.
The distribution of gold grades within the mineralised lenses is highly variable and is characterised by distinct cohesive regions of higher tenor gold grades, with clusters of individual values often reaching several hundred grams per tonne.
Whilst these higher-grade zones appear reasonably cohesive, they are manifested by a high-degree of short-scale variability, making difficult to manually interpret constraining domains.
These internal; high-grade regions are often surrounded by peripheral regions of lower grade mineralisation that is also highly variable.
Raw Coefficients of Variation (CoV) are typically in the order of 1.5-3.5, indicating moderate to high grade variability.
Some of the more substantial and higher-grade zones such as Z96 have CoV's of greater than 5.
The moderate to high grade variability and complex spatial continuity of high grades at Henty requires a pseudo non-linear approach to deal with these high grades during estimation.
A traditional approach of physical domaining, assay cutting, and linear estimation (IDW or OK) is considered inadequate in dealing with this complexity.
The estimation method applied to most of the domains combines Categorical Indicator Kriging (CIK) to define internal estimation sub-domains domains, together with applying distance limiting at chosen grade thresholds to restrict the influence of the high grade and extreme grade values during grade interpolation.
Ordinary Kriging (OK) was used to directly estimate a small number of domains that were either poorly informed with data or where grade variability did not warrant a more sophisticated approach.
Table 2 summarises the estimation method applied to each mine area by estimation domain.
Table 2:
Estimation Method – Domain Summary
|
Estimation Method |
| Mine Area |
CIK Domains |
OK Domains |
| Cradle Zone |
5201 |
5202 |
| Darwin Central |
1401, 1402, 1403, 1404 |
1405 |
| Darwin North |
1501, 1502, 1503, 1504, 1505 |
|
| Darwin South |
1101, 1102, 1103, 1104, 1105, 1106, 1108 |
|
| Intermediate Zone |
6101, 6102, 6103, 6104 |
|
| Newton Mt Julia |
2101, 2102, 2103, 2104, 2105, 2201, 2203, 2204, 2205 |
|
| Read Zone |
1301 |
1302, 1303, 1304, 1305 |
| Sill Zone |
7101, 7102, 7103 |
|
| Tear Away |
1201, 1202, 1203 |
|
| Tyndall |
3101, 3102 |
|
| Z15 |
4101, 4102, 4103, 4104 |
|
| Z96 |
5101, 5102, 5103, 5104, 5105, 5106 |
|
| Total |
49 |
6 |
Prior to estimation, a reference surface for each estimation domain was exported from the Leapfrog . This is calculated as the best fit
surface using the hangingwall and footwall surfaces. The reference surface is then imported into Surpac and a dip and dip-direction of each triangle facets is imported into the Surpac block model to provide information for dynamic search and variogram model orientation during interpolation.
Dynamic estimation is applied for estimating the CIK indicators and gold grades.
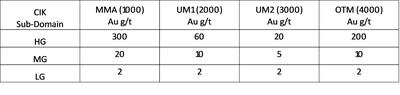
Categorical Indicator Kriging Workflow
Two Categorical Indicator values are determined for the CIK domains:
A low-grade (LG) indicator of 1.0 g/t Au was assigned to differentiate between background 'waste' and low-tenor mineralisation.
A high-grade (HG) indicator of 5.0 g/t Au was assigned to define broad areas of consistent higher-tenor mineralisation.
Indicator variograms were modelled for the LG and HG thresholds for all mine areas.
The indicator variograms for both grade thresholds exhibited a moderate nugget effect of between 20-30%. The LG indicator demonstrated well-structured average continuity of around 35m.
The HG indicator demonstrated less well-structured average continuity of around 19m.
The CIK indicators were estimated using Ordinary Kriging into a finely gridded block model with block dimensions of 1.25m x 1.25m x 1.25m.
The small block size for the indicator process is beneficial for creating categorical sub-domains at resolution which can be used to accurately back-flag composite data.
Three categorical sub-domains were generated: low-grade (LG), medium-grade (MG) and high-grade (HG) areas.
The HG sub-domain was based on an indicator probability threshold of 0.35 and the LG sub-domain was based on an indicator probability threshold of 0.65. The MG sub-domain is assigned to blocks that do not satisfy either the HG or LG sub-domain criteria.
The three categorical block model sub-domains (HG, MG and LG) were used to 'back-flag' the 1m composites from each mine area, thus creating a separate composite file for each sub-domain.
Assay top-cuts are applied to the sub-domain composite files on a domain-by-domain basis and are typically in the following ranges:
HG = 15-300 g/t Au
MG = 5-50
g/t Au
LG = 2.5-5 g/t Au
The assay top-cuts were generally between the 97th to 99.9th percentile of the distribution and were
aimed at globally limiting extreme values only. Top-cuts are not used as the primary tool to control metal risk.
The use of grade thresholds and distance limiting is considered a more objective and influential method in controlling metal risk, while better reflecting the actual localised occurrence of discontinuous high-grade gold mineralisation.
Grade variograms were initially attempted separately for the LG, MG and HG sub-domains, however, this resulted in poorly structured and incoherent variograms.
It was decided to use a variogram modelled on the combined grade data for each mine area. The combined grade variograms typically exhibited a moderate nugget effect of between 16% and 38% (average 31%) with a maximum range of continuity of between 21-45m (average 28m).
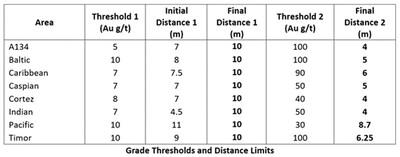
Grade thresholds for distance limiting were initially determined for each mine area from log-probability plots and visual inspection.
Final distance limits were subsequently optimised following a detailed backward-looking mill reconciliation using mine stope voids for the period May 2023 to March 2023 (230Kt).
The adjustment of grade distance limits was an iterative process until an acceptable reconciliation with the mill was achieved.
The final applied grade distance limits are follows:
0-10 g/t = No Limit
10-25 g/t = 20m
25-50 g/t = 15m
>50 g/t = 7.5m
Prior to grade estimation, sub-domain codes from the 1.25m resolution block model are imported into a 2.5m x 2.5m x 2.5m resolution model and the proportion of LG, MG and HG is calculated for each 2.5m block.
Grade estimation for the LG, MG and HG domains was undertaken in Surpac software using Ordinary Kriging with grade threshold distance limiting.
Kriging Neighbourhood Analysis (KNA) was undertaken to assist with defining estimation parameters.
Search routines and variogram orientations are drawn from the pre-populated dynamic search information recorded in each block.
Final block grades at a 2.5m x 2.5m x 2.5m block resolution were calculated by weighting the estimated grades for each sub-domain by the relevant domain proportion. The parent estimation block size was 2.5m x 2.5m x 2.5m.
A minimum of 2 and maximum of 12 composites were used for each sub-domain estimate per block.
It is possible that up to 36 composites can be used to estimate a parent block where there is a proportion of all three sub-domains present.
Block discretisation was set at 3 E x 3 N x 3 RL points (per parent block). A standardised single pass search distance of 40-60m was used.
Octant restrictions were not used. Data spacing varied from <10m x 10m to 40m x 20m.
Model validation was completed to check that the grade estimates within the model were an appropriate reflection of the underlying composite sample data, and to confirm that the interpolation parameters were applied as intended. Checks of the estimated block grade with the corresponding composite dataset were completed using several approaches involving both numerical and spatial aspects as follows:
Semi-Local: Using swath plots in X, Y and Z directions comparing the estimates to the sample data.
Local: Visual inspection of the estimated block grades viewed in conjunction with the sample data.
Ordinary Kriging Workflow
Ordinary Kriging (OK) was used to directly estimate six domains that were either poorly informed with data or where grade variability did not warrant a more sophisticated approach.
All DD, CH and SL samples were composited to 1m downhole using a best-fit methodology and
0.5 m minimum threshold on inclusions. A small number of residual composites were retained in the estimation.
Composite files were statistically analysed in Supervisor software, with assay top cuts defined. Top cuts of between 7.5-15 g/t were applied to the data to control the effects of outlier high grade Au values that were considered not representative. The effect of the top cuts was reviewed with respect to the resulting Mean and CV values.
Kriging Neighbourhood Analysis was undertaken to assess the effect of changing key kriging neighbourhood parameters on block grade estimates. Kriging efficiency and slope of regression were determined for a range of block sizes, minimum/maximum samples, search dimensions and discretisation grids. Variograms were generated using composited top-cut drill data in Snowden Supervisor v8 software.
Within each domain, an Ordinary Kriging estimate of gold grade was produced using the cut composite data.
A standardised single pass search distance of 60m was used.
Octant restrictions were not used.
Hard boundaries were used for the estimate.
To enable the use of dynamic variograms and search orientations during the estimation of gold, the reference surfaces for each domain were exported from the Leapfrog project. This is calculated as the best fit surface using the hanging wall and footwall surfaces.
A minimum of 2 and maximum of 12 (1 m composite) samples per block were used with no limit of samples per drillhole. The minimums and maximums were established through independent KNA on each major domain. Block discretisation was set at 3 E x 3 N x 3 RL points (per parent block).
Octant restrictions were not used, and estimates were into parent blocks, not sub-blocks.
Drill spacing was approximately 20m by 20m or closer. Block dimensions were 2.5m x 2.5m x 2.5m (XYZ).
Model validation was completed to check that the grade estimates within the model were an appropriate reflection of the underlying composite sample data, and to confirm that the interpolation parameters were applied as intended. Checks of the estimated block grade with the corresponding composite dataset were completed using several approaches involving both numerical and spatial aspects as follows:
Semi-Local: Using swath plots in Northing and RL comparing the estimates to the sample data.
Local: Visual inspection of the estimated block grades viewed in conjunction with the sample data.
10.
Bulk Density
CSA Global in 2023 were supplied 5,096 "Weight Wet" and "Weight Dry" records determined from 1,662 individual drillholes
via
the
Archimedes
(water immersion) method. Density was calculated from the data by the following equation:
Density= (Weight Air)/ (Weight Air-Weight Water)
The available density data was selected from within the mineralised zone interpretations for the various model areas. Outlier samples were removed from the data selected and a global average of density was calculated. A value of 2.8
t/m3 was determined, which has been applied directly to the model cells for all block model areas. No new density data was available for the 2024 MRE.
11.
Classification Criteria
Mineral Resources were classified as Indicated and Inferred to appropriately represent confidence and risk with respect to data quality, drill hole spacing, geological and grade continuity and mineralisation volumes. Additional considerations were the stage of project assessment, current understanding of mineralisation controls and mining selectivity within an underground mining environment.
The drilling, surveying and sampling undertaken, and analytical methods and quality controls used, are appropriate for the style of deposit under consideration.
Indicated Mineral Resources
were defined where a moderate level of geological confidence in geometry, continuity and grade was demonstrated, and were identified as areas where:
The portions of the Henty Gold Mine 2024 MRE classified as Indicated have been flagged in areas of the model where average drill hole spacing is 20m x 20m or closer. The drill spacing within the Indicated portion of the resource is appropriate for defining the continuity and volume of the mineralised domains, at a nominal 20 m drill spacing on 20 m sections.
Blocks were interpolated with a neighbourhood largely informed by the maximum number of samples.
Inferred Mineral Resources
were defined where a low to moderate level of geological confidence in geometry, continuity and grade was demonstrated, and were identified as areas where:
Drill spacing averaged a nominal 40 m or less, or where drilling was within 40 m of the block estimate.
Further considerations of resource classification include; data type and quality (drilling type, drilling orientations, down hole surveys, sampling and assaying methods); geological mapping and understanding; statistical performance including number of samples, slope regression and kriging efficiency.
Mineralisation within the model which did not satisfy the criteria for classification as Mineral Resources remained unclassified.
The delineation of Indicated and Inferred Mineral Resources appropriately reflects the Competent Person's view on continuity and risk at the deposit.
12.
Cut-off Grade
The Henty underground Mineral Resources is reported at a cut-off grade of 1.5 g/t Au. The cut-off grade has been derived from current mining and processing costs and metallurgical parameters.
Inputs into the cut-off grade calculation include:
Mining Fixed and Variable = AUD$66/t
Grade Control = AUD$12/t ore
Processing Costs = AUD$28/t ore
Maintenance Costs = AUD$43/t ore
Metallurgical Recovery = 92%
Royalties = 5.9%
Gold Price = AUD$3,500/oz
In addition to applying a cut-off grade of 1.5 g/t Au, the Mineral Resource has been reported within an underground Shape Optimiser (SO) evaluation from the undiluted and depleted resource model.
SO input parameters include a minimum mining width of 1.5m, minimum stope length of 5m, stope height of 16m.
13.
Assessment of Reasonable Prospects for Eventual Economic Extraction
The Henty Gold Mine Mineral Resource (MRE) has been undertaken with a focus on delineating areas of the MRE with Reasonable Prospects for Eventual Economic Extraction (RPEEE) by underground mining methods.
The MRE has been constrained within an underground Shape Optimiser (SO) evaluation from the depleted resource model that contains 75% or greater of its volume as in-situ material.
SO input parameters include a 1.5 g/t Au cut-off, minimum mining width of 1.5m minimum stope length of 5m, stope height of 16m.
The orientation of SO's is variable depending on the geometry of the mineralisation
resource model.
The Mineral Resource is considered to have reasonable prospects for eventual economic extraction (RPEEE) given the access to critical infrastructure, the volume and grade of mineralisation available for mining and the RPEEE criteria which have been applied prior to reporting the Mineral Resource.
14.
Mining and Depletion
Underground mining at Henty has taken place since 1996. Mining depletion to January 31, 2024, was applied to the model.
No dilution or cost factors were applied to the estimate.
15.
Metallurgy
Henty is an operating mine and there are no material metallurgical issues that are known to exist.
No metallurgical recovery factors were applied to the Mineral Resources or resource tabulations.
This announcement has been approved for release by the Board of Directors of Catalyst Metals Limited.
Competent person's statement
The information in the report to which this Mineral Resource Statement is attached that relates to the estimation and reporting of gold Mineral Resources at the Henty Gold Mine is based on information compiled by Mr Andrew Finch, BSc, a Competent Person who is a current Member of Australian Institute of Geoscientists (MAIG 3827). Mr Finch, Geology Manager, at Catalyst Metals Ltd has sufficient experience relevant to the style of mineralisation and deposit type under consideration and to the activities being undertaken to qualify as a Competent Person as defined in the 2012 Edition of the Australasian Code for Reporting of Exploration Results, Mineral Resources and Ore Reserves. Mr Finch consents to the inclusion in the report of matters based on his information in the form and context in which it appears.
The information in this report that relates to Ore Reserves is based on and fairly represents information and supporting documentation compiled by Anthony Buckingham BEng (Mining Engineering), a Competent Person who is a member of the Australasian Institute of Mining and Metallurgy (AUSIMM). Anthony Buckingham is a full-time employee of Catalyst Metals. He is a shareholder in Catalyst Metals and is entitled to participate in the Catalyst Performance Rights Plan.
Anthony Buckingham has sufficient experience that is relevant to the style of mineralisation and type of deposit under consideration and to the activity being undertaken to qualify as a Competent Person as defined in the 2012 Edition of the Australasian Code for Reporting of Exploration Results, Mineral Resources and Ore Reserves (JORC 2012).
Anthony Buckingham consents to the inclusion in the report of the matters based on his information in the form and context in which they are presented.
This Ore Reserve estimate has been compiled in accordance with the guidelines defined in the 2012 Edition of the Australasian Code for Reporting of Exploration Results, Mineral Resources and Ore Reserves (JORC 2012).
The information in this presentation to which this Exploration Target relates is based on information compiled by Mr Andrew Finch, BSc, a Competent Person who is a current Member of Australian Institute of Geoscientists (MAIG 3827). Mr Finch, Geology Manager, at Catalyst Metals Ltd has sufficient experience relevant to the style of mineralisation and deposit type under consideration and to the activities being undertaken to qualify as a Competent Person as defined in the 2012 Edition of the Australasian Code for Reporting of Exploration Results, Mineral Resources and Ore Reserves. Mr Finch consents to the inclusion in the report of matters based on his information in the form and context in which it appears.
JORC 2012 Mineral Resources and Reserves
Catalyst confirms that it is not aware of any new information or data that materially affects the information included in the original market announcements and that all material assumptions and technical parameters underpinning the estimates in the relevant market announcements continue to apply and have not materially changed. The Company confirms that the form and context in which the Competent Persons findings are presented have not been materially modified from the original market announcements.
APPENDIX 1
PLUTONIC UNDERGROUND – JORC CODE, 2012 EDITION – TABLE 1
Section 1 Sampling Techniques and Data
Plutonic Underground Deposit
(Criteria in this section apply to all succeeding sections.)
| Criteria |
Commentary |
| Sampling techniques |
Over its 33-year production history, the Plutonic deposit has been sampled using numerous drilling and sampling techniques by Billabong Gold Pty Ltd (Billabong - 100% owned Catalyst Metals Limited) and previous operators. Drilling and sampling techniques by previous operators is assumed to be to industry standard at that time.
For Mineral Resource estimation the Plutonic main underground area has been predominantly based on diamond drilling (DD) from surface and underground platforms and underground rock chip face samples (FS). Reverse Circulation (RC) drilling makes up a small proportion of the data set and has been carried out at the Plutonic main deposit for delineation of open pit material.
For DD samples, downhole depth is recorded by the drillers on core blocks after every run. This is checked and compared to the measurements of the core by a geologist to honour geological boundaries (lithology, mineral assemblage, alteration etc). Sample lengths typically vary between 0.3m and 1.0m.
DD core is orientated using a Reflex ACT device and detailed structural measurements and logging is carried out. Exploration DD core is sawn in half along the orientation lines, with half the sample being submitted for assay and the remaining half being retained for reference. Grade control DD core is whole core sampled and sent for analysis.
RC samples were collected for each metre drilled and passed through a cyclone and riffle splitter to produce a two kg to four kg assay into calico bags.
FS samples are completed by the mine geologists. The sampling is taken by chipping the face into calico bags with definition by lithological boundaries. FS samples are taken perpendicular to the lode orientation in the face. The face sample locations are marked up and measured from fixed survey points.
|
| Drilling techniques |
Diamond core diameters include BQ (36.4 mm), BTW (42 mm), LTK60 (43.9 mm), NQ (47.6 mm), NQ2 (50.7 mm).
RC holes were drilled with face hammers and were sampled at one metre down hole intervals.
|
| Drill sample recovery |
DD recovery is not noted specifically, though core is locked in and meter marked carefully. Discrepancies to core blocks are brought up with the drill contractor. Occasionally core loss blocks are inserted. Overall drill core recovery is very good.
Billabong diamond drilling practice results in high core recovery due to the competent nature of the ground.
Chip sample recoveries are not relevant in this instance. No RC drilling has taken place for a number of years at Plutonic and impact on the resource would be minimal.
RC and DD by previous operators is assumed to be to industry standard at that time.
There is no known relationship between sample recovery and grade; diamond drill sample recovery is very high.
|
| Logging |
DD core, RC samples and FS chip samples have been logged by qualified geologists to a level of detail to support appropriate Mineral Resource estimation, mining studies and metallurgical studies.
Logging and face mapping is qualitative and quantitative. Visual estimates of sulphide (percentage) and alteration (intensity scale) are recorded. Core Logging and face mapping notes lithology, alteration, mineralisation and structures. Structural readings are taken at relevant structures and where the foliation is relatively consistent.
All DD core is digitally photographed and logged. Faces are mapped and sampled when access permits.
|
| Sub-sampling techniques and sample preparation |
If the DD core was BQ, LTK48 or BTW it was sampled as full core and dispatched to the laboratory for analysis. Most LTK60 and NQ2 DD core is cut in half with an Almonté diamond core saw; the top half of the core was sent to the laboratory for analysis and the other half was placed back in the core tray, transferred onto pallets, and moved to the core yard library. All GC drilling, regardless of core size, is whole core sampled.
RC samples were collected for each metre drilled and passed through a cyclone and riffle splitter to produce a two kg to four kg assay into calico bags. Depending on the oxidation state of the rock, the sample weight varied between three and five kilograms. A duplicate sample was also collected and retained in a temporary sample storage facility for further check sampling. The RC drilling and sampling were supervised at the drill site by a company sampler and geologist. The riffle splitter was cleaned using compressed air after every sample and the cyclone was cleaned every 40 m, or more regularly at the geologists' discretion. Wet or damp RC samples were allowed to dry before riffle splitting.
FS chip samples are taken by chipping the face into calico bags with definition by lithological boundaries.
Sample preparation procedures for DD and FS includes:
1-4 hours drying at 150°C depending on moisture content;
Crush 85% < 3mm –
Essa jaw crusher or rotary Boyd crusher;
Riffle split 50:50 to<1kg;
Pulverise ~700-750g to 90% passing 75μm in Labtechnics LM2;
Scoop 250-300g;
Scoop to subset to 40gm for fire assay.
Quality control procedures for DD and FS includes:
FS – blanks added to each face sample with ore zones;
DD –barren wash and blanks added after each ore interval;
Crusher duplicates taken at 1:40;
Pulp duplicates taken at 1:40.
Sample preparation protocols and sample sizes are considered appropriate for the style of mineralisation encountered and should provide representative results.
|
| Quality of assay data and laboratory tests |
The Plutonic Gold Mine has been in operation since 1990 following discovery in 1988. QAQC procedures have changed throughout that period. The current underground Mineral Resources have been identified over a long period of time with a number of companies. All high confidence Mineral Resources are based dominantly on underground DD and FS completed in the last 14 years.
In recent years, for DD and FS, gold concentration is determined by fire assay using the lead collection technique with a 40gm sample charge weight. An AAS (Plutonic lab) or ICP (ALS and Bureau Veritas) finish.
A Pulverising and Leach (PAL) method was introduced to the Plutonic site laboratory in 2005. Underground GC samples are initially assayed by PAL and where the result is greater than 0.5 g/t Au the sample is re-analysed by 40gm fire assay and the fire assay result is retained for grade estimation purposes. It has been shown that the use of PAL assays is likely to have negligible influence on the Sept 2023 MRE.
Although PAL is not considered to be a total gold analysis, the larger sample size still produces a representative result. Fire assay gold analysis is considered to be total gold.
Samples are dried, crushed and pulverised prior to analysis.
Certified Reference Material (CRM's) are submitted every 20 samples for DD and once per shift for FS (approx. 1 in 15 samples). CRM's are of similar grade tenor to those expected in the sampling. The CRM insertion rate ensures that there are at least two CRM's per assay batch. CRM's are selected based on their grade range and mineralogical properties with an emphasis on sulphide ores.
Blanks are inserted every 20 samples for DD and for FS they are inserted after any face that contains mineralisation.
Grind checks or sizing was carried out on a frequency of 1 in 40 on both pulp residues and crush residues prior to January 2020. Since January 2020, crush sizing analysis is conducted randomly. The data is collected throughout the shift with results calculated at the end of shift. Pulp residues are expected to have 90% passing ≤75μm. The crush residue is expected to have 80% passing ≤3 mm. This data is monitored by the Laboratory Supervisor. Grind times can be lengthened accordingly.
Field, crush and pulp duplicates, occur at a frequency of 2.5%.
Current procedures dictate a process of validation and checking of laboratory results when data is returned by the laboratory as it is loaded into the acQuire database. A standard set of plots and checks are undertaken, and if results fall outside of the expected limits, then re-assaying is requested. Monthly QAQC reports are generated by the database administrator and documented from automated routines out of the database.
A comprehensive review of QAQC results was carried out for the CIM NI 43-101 report relating to the 2022 Mineral Resource and Reserve Estimate for the Plutonic Estimate (2022 MRE – Effective Date December 31, 2021).
Conclusions from the 2022 MRE Qualified Person include:
Overall performance of the Plutonic site and external laboratory (ALS) are adequate for estimating and reporting Mineral Resources for the Plutonic underground operations despite some minor shortcomings in the site laboratory;
The accuracy of the laboratories is within 3% error;
The variance of the laboratories (precision) based on CRM's is acceptable for underground production purposes;
Both ALS and Plutonic laboratories performed well on precision and accuracy with ALS lab slightly better precision;
Coarse duplicates revealed relative errors at 20% for samples with Au >7 g/t and 30% relative errors for samples with Au between 3 and 7 g/t;
50% of the errors of the coarse duplicates may have been caused by a coarse gold nugget effect. The remaining errors were likely caused by contamination, other laboratory procedure breaches and human error.
At the Plutonic Laboratory there was:
some low-level contamination at crushing stage;
some minor procedural non-compliance at crushing, pulverising, and instrument assaying stage;
periodic increased assaying uncertainty may be caused by possible human errors;
the extent of the laboratory contamination is unknown given the random nature of the blank insertion;
upper limit for blanks of 0.2
g/t is too high to effectively detect contamination.
At ALS Laboratory there was:
there was insignificant contamination at the lab during the period;
the laboratory has performed consistently well;
laboratory precision test on
CRM's indicated a better performance than CRM manufacturer.
DD and FS data collected since the 2022 MRE consists almost entirely of additional grade control data and represents a relatively small proportion of the total dataset used for the JORC June 30, 2023 Mineral Resource Estimate (Sept 2023 MRE).
Conclusions from the Sept 2023 MRE Competent Person include:
Results indicate that the QAQC performance is sufficient for using the data for an underground Mineral Resource Estimate;
Element of risk in using PAL due to incomplete digestion;
Site laboratory performance (the majority of the samples) is poorer than off-site labs (ALS and Bureau Veritas) – contamination and percentage of CRM failure;
Site laboratory shows poorer performance at low levels of Au (0.4 - 0.8 g/t), but effect on underground Mineral Resources likely to be minimal;
Precision of
CRMs for site laboratory poorer than manufacturer.
|
| Verification of sampling and assaying |
DD and face logging is completed electronically onto laptops. Database protocols and rules are applied upon data entry.
Visual validation and check logging of face and drill data.
Drill data is stored in an AcQuire database, face data in an Acquire. All maintained full-time Database Administrator.
All face and drill data within site databases are regularly validated using both internal database systems and external validation tools.
Validation of pre-Billabong data is completed periodically.
There is no requirement for twinned holes in a production setting.
Conversion of lab non-numeric codes to numeric for estimation.
|
| Location of data points |
UG hole collar locations are picked up regularly by site surveyors.
Multi shot cameras are used for down-hole survey.
Development faces are spatially located using MineMapper and Vulcan 3D software.
Underground development voids are picked up regularly by site surveyors. Stopes voids are generally all surveyed by CMS (where practical and safe to do so).
|
| Data spacing and distribution |
Plutonic underground Mineral Resources are primarily based on DD and FS data.
Given the high degree of grade variability and spatial complexity at the Plutonic underground mine (extremely high nugget effect and minimal short-scale spatial continuity), it is difficult to generate local scale grade estimates that would adequately satisfy a Measured Resource classification. For this reason, no Measured material has been included in the Sept 2023 MRE. Indicated Resources can be reasonably well-defined with DD spacing up to 30m × 30m. Average data spacing for Indicated resources for the Sept 2023 MRE is approximately 20m× 20m. Inferred resources are assigned to areas where DD spacing is generally greater than 30m × 30m.
Grade control DD spacing typically required for stope definition is between 8m × 8m to 10m ×10m. Close spaced FS are also used for stope definition.
The data spacing and distribution is sufficient to establish geological and/or grade continuity appropriate for the Mineral Resource and classifications to be applied, with known likelihood of local variability.
The drill core is logged and divided into sample intervals that have a minimum sample length of 0.3m and a maximum sample length of 1.0m. Intervals should honour geological boundaries such as faults and lithological contacts. Most nominal sample lengths were at 1m intervals; sample compositing is not applied until the estimation stage.
Compositing of the data to 1m was used in the estimate.
No recent RC drilling has been undertaken
|
| Orientation of data in relation to geological structure |
Drilling is orientated as close to perpendicular to mineralisation where possible. However, orientation to lode may be compromised by access to suitable drill platforms. Drillholes are extended to Mine Mafic boundary where required and practicable.
Face sampling is orientated perpendicular to lode orientation.
The variable drill orientation relative to mineralisation is not thought to make a material difference in the resource estimation.
|
| Sample security |
All cut drill core is kept in an unfenced core farm adjacent to the core cutting and processing shed. This is not regarded as a security risk due to the remote location of the mine with no community development near the mine. All core is photographed and records kept electronically.
Geologists are responsible for marking the sample intervals and placement of Blanks and Standards within the sampling stream for both faces and core. The Project Geologist and Senior Geologist complete quality control checks on the face data daily.
Field Staff are primarily responsible for the collection of samples from the face as chips, as well as the cutting and sampling of core. Also generating the sample numbers for core submission, creating a sample submission sheet for core and faces, randomly selecting and recording the standards to be sent to the laboratory and the transportation of the samples to the laboratory.
Once a hole has been sampled, the sample calculation and check geology documents are handed to the Database Administrator (DBA) who converts the digital copy of the sample calculation to a .csv file which is then imported into the AcQuire database.
Upon receiving the digital file for the assay data, the DBAs import the file into the master AcQuire database. This data is not accessible for assessment until it has been validated as complete and correct by the QAQC Geologist and DBA. Face data is received in the same format and is entered into the AcQuire database.
Pulp rejects from assayed samples are kept in wooden boxes on top of the waste dump. These are visited frequently as samples are taken for research and other purposes.
Drill logs are kept in hard copy and electronically and are available for checking and due-diligence.
|
| Audits or reviews |
A review by Jacqui Coombes (Coombes, 2009) concluded that it was reasonable to combine the drillhole and face sampling data for the Plutonic deposit – report sighted.
A previous review by Roscoe Postle and Associates (RPA) in 2012 concluded that the data verification systems were adequate for Mineral Resource estimation.
Previous estimation process review by Optiro (2015) identified that reduced manning levels were having an impact on the quantity and quality of the data being generated in 2015, however, overall, the data collection systems which support the Mineral Resource estimation process were found to be best practice – report unsighted.
In 2022, SnowdenOptiro completed a technical review of the 2022 Mineral Resource Estimate prior to a public release. This report indicated some concerns about smearing of high grades into low grade areas, the assignment of Measured and Indicated resources in areas of low data density and the lack of a reconciliation analysis against the estimate.
No external audits or reviews have been undertaken on the Sept 2023 Mineral Resource Estimate.
|
Section 2 Reporting of Exploration Results
Plutonic Underground Deposit
(Criteria listed in the preceding section also apply to this section.)
| Criteria |
Commentary |
| Mineral tenement and land tenure status |
The Plutonic Gold Mine group includes 30 granted exploration and mining tenements (24 mining leases, 2 exploration licences, and 4 prospecting licences) (as such term is defined in the (Western Australian) Mining Act 1978 (the "Mining Act"))
All rents to Department of Mines, Industry Regulation and Safety ("DMIRS") have been paid and made within one month after the anniversary commencement date of the tenement as allowed under the Mining Act.
All tenement Shire rates have either been paid or will be paid within the required timeframes.
All compliance reporting including Form 5 Reports, have been lodged within the timeframes allowed under the Mining Act 1978 as amended.
All Geological Reports have been lodged.
There are no other unexpected encumbrances registered or recorded against the tenements.
There are no Forfeiture proceedings against any tenements.
|
| Exploration done by other parties |
1969-1976 – International Nickel Company (Inco) conducted nickel exploration using geochemistry, geophysics, costeaning, RAB and RC drilling.
1987 – Great Central Mines (GCM) identified an arsenic and gold anomaly by geochemical sampling in the Plutonic tenements.
1987-1993 – Battle Mountain Australia (BMA) undertook regional mapping, Bulk Leach Extractable Gold (BLEG) soil sampling, and RAB drilling. The Triple P, Pelican, Albatross and Flamingo deposits were discovered in 1992. Further RAB, AC, RC and DD programs were conducted to define these deposits.
1988-1994 - Resolute Resources Ltd (75%) and Titan Resources NL (25%) commenced exploration on the Marymia tenements. Gold mineralisation was discovered in the Keillor Shear Zone following regional exploration soil, stream sediment and rock chip sampling and geological mapping. Several phases of follow-up RAB, AC, RC and DD drilling was carried out. K1 deposit was discovered in 1989. Prospect scale geophysical surveys including magnetics and gradient array IP were undertaken between 1989 and 1994.
1990 – GCM carried follow up grid-based mapping, soil and lag geochemical surveys which led to the discovery of the Plutonic deposit.
1990 – GCM discovered satellite deposits at Area4 and Channel. Both were mined by open pit between 1999 and 2001.
1990-1995 – Plutonic Resources exploration division carried out exploration on the Freshwater tenements and discovered a total of 1 underground and 30 surface prospects. Follow up resource definition drilling resulted in conversion of these prospects to 10 open pits and one underground mine, including Area 4 open pit, Plutonic East underground deposit, Salmon, Trout and Perch.
1999-2004 - Homestake Gold of Australia undertook a detailed aeromagnetic and radiometric survey over the entire lease area. Additional IP and moving loop geophysical surveys were undertaken between 2000 and 2004 across several prospects. The largest of which was across the K1-K2 project area in 2004.
2004 - the Plutonic Development department undertook a large soil sampling programme over the northwestern end of the Marymia tenements, in conjunction with the IP survey. These surveys identified a number of targets that were followed up with some additional surface geochemical sampling.
2001-2007 - exploration and resource definition drilling by RAB, RC and diamond core drilling was undertaken by the Plutonic Development department across numerous prospects outside of the Plutonic Mine area. Many of these drilled prospects were proven up to become small satellite open pit mines such as Triple P B-Zone, Albatross, Flamingo, Kookaburra, Ibis, Piranha, to name a few.
2009-2012 - RC and diamond core drilling concentrated on extensions to the known Plutonic deposit. Outside of this area two 2D seismic lines were shot in conjunction with Curtin University and diamond core drill was undertaken at Plutonic West and Cod prospects.
|
| Geology |
The gold deposits at Plutonic are hosted by an Archaean greenstone sequence and occur mainly as a multiple lode system with variable dip (horizontal to vertical) hosted almost exclusively by a mafic amphibolite sequence that is referred to as the 'Mine Mafic'.
Mineralisation regularly occurs as shallowly dipping, layer parallel lodes, although steep lodes and minor quartz-vein hosted deposits also occur. Mineralisation at Plutonic is characterized by a series of moderately-dipping to very flat-lying, stacked replacement-style lodes, individually up to five metres wide, that are hosted within ductile shear zones, oriented slightly oblique to stratigraphy.
|
| Drill hole Information |
No exploration has been reported in this release, therefore there are no drill hole intercepts to report. This section is not relevant to this report on Mineral Resource and ore Reserves.
|
| Data aggregation methods |
No exploration has been reported in this release, therefore there are no drill hole intercepts to report. This section is not relevant to this report on Mineral Resource and ore Reserves.
|
| Relationship between mineralisation widths and intercept lengths |
No exploration has been reported in this release, therefore there are no drill hole intercepts to report. This section is not relevant to this report on Mineral Resource and ore Reserves.
|
| Diagrams |
No exploration has been reported in this release, therefore there are no drill hole intercepts to report. This section is not relevant to this report on Mineral Resource and ore Reserves.
|
| Balanced reporting |
No exploration has been reported in this release, therefore there are no drill hole intercepts to report. This section is not relevant to this report on Mineral Resource and ore Reserves.
|
| Other substantive exploration data |
No exploration has been reported in this release, therefore there are no drill hole intercepts to report. This section is not relevant to this report on Mineral Resource and ore Reserves.
|
| Further work |
Underground grade control and extensional drilling programs are underway, and will continue in line with mine development and production requirements.
|
Section 3 Estimation and Reporting of Mineral Resources
Plutonic Underground Deposit
(Criteria listed in section 1, and where relevant in section 2, also apply to this section.)
| Criteria |
Commentary |
| Database integrity |
The Plutonic Mineral Resource database is regularly validated by Billabong staff using data validation modules of Vulcan, Leapfrog and AcQuire software programs to identify any inconsistencies or logical errors in the data. Mine staff also visually check the drill hole data on-screen on a regular basis.
Surface and underground drill hole and face data is validated to produce a digital database free of detected errors. This is undertaken by passing data through embedded macros and queries of the drill hole database software by table (collar, assay, lithology, survey, and grout).
Crosschecks are also undertaken to ensure that each drill hole has data from collar, assays, lithology, survey, and grout files. By undertaking the above procedures, all drill hole and face data is rigorously checked, verified, and corrected where necessary to ensure limited failures.
Surface and underground drill hole and face data is validated to produce a digital database free of detected errors. This is undertaken by passing data through embedded macros and queries of the drill hole database software by table (collar, assay, lithology, survey, and grout). Crosschecks are also undertaken to ensure that each drill hole has data from collar, assays, lithology, survey, and grout files. By undertaking the above procedures, all drill hole and face data is rigorously checked, verified, and corrected where necessary to ensure limited failures.
|
| Site visits |
The Competent Persons have not undertaken a site visit at the time of this release. A site visit is planned in the near future.
|
| Geological interpretation |
The confidence in the geological interpretation is high with all the information and over 30 years of open pit and underground operation used in the generation of the models.
All available geological data was used in the interpretation, including drilling and mapping (~29,000 drillholes and ~120,000 faces).
The modelling approach takes advantage of many thousands of structural measurements from orientated diamond holes and underground development faces to build structural trend surfaces, and uses these trend surfaces to determine the mineralisation trend in domaining and grade estimation.
Mineralisation regularly occurs as shallowly dipping, layer parallel lodes, although steep lodes and minor quartz-vein hosted deposits also occur. Plutonic style mineralisation is characterised by a significant population of high to extreme gold grades that demonstrate very poor spatial continuity (only a few meters at best). These high-grade populations tend to occur in 'clusters' or cohesive zones on a large scale, however, the actual spatial continuity is very poor at a local scale, making it difficult to define robust zones of continuity without introducing significant bias.
|
| Dimensions |
Mineralisation extents:
Strike length = 3,200m (North – South)
Width = 2,200m (East-West)
Depth = Surface to 400mRL (~1,100m below surface)
The Plutonic mine is sub-divided into eight mine areas corresponding to historical resource zones:
Timor Pacific A134 Cortez Baltic Caribbean Indian Caspian |
| Estimation and modelling techniques |
Plutonic gold mineralisation is almost entirely hosted within the Mine Mafic Unit (MMA) and characterised by a significant population of high to extreme gold grades that demonstrate very poor spatial continuity (only a few meters at best). Raw Coefficients of Variation (CoV) are typically in the order of 15-30, indicating extreme statistical variability.
The extreme grade variability and lack of spatial continuity of high grades requires a non-linear approach to deal with these high grades during estimation. A traditional approach of physical domaining, assay cutting, and linear estimation (IDW or OK) is considered inadequate in dealing with this complexity.
The estimation method developed for the Sept 2023 MRE combines Categorical Indicator Kriging (CIK) to define broad estimation domains, together with applying distance limiting at chosen grade thresholds to restrict the influence of the high grade and extreme grade values during grade interpolation.
Prior to estimation, a closely spaced set of structural surfaces are developed in LeapFrog reflecting the primary controls on mineralisation within the MMA. A dip and dip-direction of each triangle facets is imported into the Surpac block model to provide information for dynamic search and variogram model orientation during interpolation. Dynamic estimation is applied for estimating the CIK indicators and gold grades.
All DD and FS data was composited to 1m downhole and data within dolerite dykes or vein zones were removed. Composited data was split into the eight mine areas.
Two Categorical Indicator values are determined for each mine area:
A low-grade (LG) indicator to differentiate between background 'waste' and low-tenor mineralisation – around 0.5 g/t Au.
A high-grade (HG) indicator to define broad areas of consistent higher-tenor mineralisation – typically between 1.1 g/t and 1.7 g/t Au.
Indicator variograms were modelled for the LG and HG thresholds for all mine areas. The indicator variograms for both grade thresholds exhibited a moderate nugget effect and demonstrated well-structured continuity up to 30m. The CIK indicators were estimated using Ordinary Kriging into a finely gridded block model with block dimensions of 1.25m x 1.25m x 1.25m. The small block size for the indicator process is beneficial for creating categorical sub-domains at resolution which can be used to accurately back-flag composite data.
Three categorical sub-domains were generated for low-grade (LG), medium-grade (MG) and high-grade (HG) areas. The HG sub-domain was based on an indicator probability threshold of 0.35 and the LG sub-domain was based on an indicator probability threshold of 0.65. The MG sub-domain is assigned to blocks that do not satisfy either the HG or LG sub-domain criteria.
It is well-known that Plutonic mineralisation is characterised by a significant population of high to extreme gold grades that demonstrate very poor spatial continuity (only a few meters at best). All mine areas exhibit the presence of a high-grade population beginning at around 7-10 g/t Au. This high-grade population typically occurs around the 95-98th percentile of the distribution within the host Mine Mafic Unit (MMA). A further 'extreme' grade population is often evident at between 30-100 g/t Au depending on the mine area. This 'extreme' grade population is typically above the 99th percentile of the distribution. Whilst the 7-10 g/t Au population tends to occur in 'clusters' or cohesive zones on a large scale, the actual spatial continuity is very poor at a local scale, making it difficult to define robust zones of continuity without introducing significant continuity bias. Previous attempts to create hard domains of continuity at a 10 g/t Au cut-off often resulted in overstating the volume, grade, and continuity of these zones. The 'extreme' grade population noted above, often appears very clear on a log-probability plot, however, there is almost no cohesive spatial continuity of these grades.
The three categorical block model sub-domains (HG, MG and LG) were used to 'back-flag' the 1m composites from each mine area, thus creating a separate composite file for each sub-domain.
Standardised assay top-cuts are applied to the composite files as follows:
HG = 300 g/t Au MG = 40 g/t Au LG = 20 g/t Au
The assay top-cuts were generally above the 99.9th percentile of the distribution and were aimed at globally limiting extreme values only. Top-cuts are not used as the primary tool to control metal risk. The use of grade thresholds and distance limiting is considered a more objective and influential method in controlling metal risk, while better reflecting the actual localised occurrence of discontinuous high-grade gold mineralisation.
Grade variograms were modelled for the LG, MG and HG sub-domains for all mine areas. The HG grade variograms exhibited a very high nugget effect (75-82%) with maximum ranges of only a few meters (2.9-3.9m). Grade variography undertaken on the HG domain confirms the extremely variable nature of Plutonic mineralisation. As expected, grade variography on the MG and LG domains resulted in lower nuggets effects and longer ranges. Given the similarities between the spatial characteristics between all mine areas, it was decided to use an average gold grade variogram for each domain across all mine areas.
Grade thresholds for distance limiting were determined for each mine area from log-probability plots. Initial distance limits were determined by undertaking indicator variography at each grade threshold value. Indicator variography was restricted to areas of high data density and similar orientation to maximise clarity of continuity. The grade thresholds and distance limits are shown in the table below:
Prior to grade estimation, sub-domain codes from the 1.25m resolution block model are imported into a 2.5m x 2.5m x 2.5m resolution model and the proportion of LG, MG and HG is calculated for each 2.5m block.
Grade estimation for the LG, MG and HG domains was undertaken in Surpac software using Ordinary Kriging with grade threshold distance limiting. Initial grade thresholds and distance limits were applied using the parameters defined in the table above. Search routines and variogram orientations are drawn from the pre-populated dynamic search information recorded in each block.
Final block grades at a 2.5m block resolution were calculated by weighting the estimated grades for each sub-domain by the relevant domain proportion.
The parent estimation block size was 2.5m x 2.5m x 2.5m. A minimum of 3 and maximum of 12 (1 m composite) samples per block were used. Block discretisation was set at 3 E x 3 N x 3 RL points (per parent block).
A standardised search ellipse of 25m x 25m x 6.25m was used. Octant restrictions were not used.
Data spacing varied from 3m x 3m to >40m x 40m.
The entire Plutonic model was estimated based on the 'Initial' Distance 1 limits as shown in the table above. A backward-looking mill reconciliation was carried out using mine CMS stope voids for the period Jan to August 2023 (550Kt). The initial distance limits resulted in a 15% under-call compared to the mill reconciliation for the period. The Distance 1 limits were therefore modified and the model was re-run. The final grade threshold and distance limits shown in the table below resulted in the final Sept 2023 MRE being within 4.1% (above) of mill reconciliation. Given there is always a small amount of additional operational metal loss between in-situ CMS model reports and actual production, the actual reconciliation between the Sept 2023 MRE and Mill is likely to be slightly better than within 4.1%.
No deleterious elements were estimated or assumed.
No selective mining units were assumed in the resource estimate.
Only gold grade was estimated.
The model was validated by comparing statistics of the estimated blocks against the composited sample data; visual examination of the of the block grades versus assay data in section; swath plots; and reconciliation against previous production.
Mining depletion to June 30th 2023 was applied to the model. Mining depletion is represented as a 'void proportion' at a 2.5m block resolution.
|
| Moisture |
All estimations were carried out on a 'dry' basis.
|
| Cut-off parameters |
Plutonic underground Mineral Resources are reported at a cut-off grade of 1.5
g/t Au. The cut-off grade has been derived from current mining and processing costs and metallurgical parameters.
|
| Mining factors or assumptions |
The Plutonic underground Mineral Resource estimate is reported within an underground Shape Optimiser (SO) evaluation from the undiluted and depleted resource model. SO input parameters include a 1.5 g/t Au cut-off, minimum mining width of 3m, minimum stope length of 5m, stope height of 15m and a gold price of AUD$2,800/oz.
The orientation of SO's is variable depending on the geometry of the mineralisation.
|
| Metallurgical factors or assumptions |
It is assumed the material will be processed at the Plutonic Gold Plant. Recovery factors are assigned based on-going experience.
No metallurgical modifying factors or assumptions have been built or applied to the resource model.
|
| Environmental factors or assumptions |
The Plutonic underground operation is a going concern and as such previous practices have proven to be effective and practical.
A conventional storage facility is used for the process plant tailings.
The small amount of waste rock is stored in a traditional waste rock landform 'waste dump'. Due to low sulphide content and the presence of carbonate alteration the potential for acid drainage formation is considered to be low.
|
| Bulk density |
Bulk density is determined from drill core using a weight in air/weight in water method. Currently there is a database of over 3,800 bulk density measurements which have been taken from mineralised and unmineralised intervals, with an ongoing sampling program in place.
Samples of between 0.5 and 2.0kg are weighed in air and weighed in water. The following equation is used to derive bulk density Bulk Density = Wd / (Wd−Ww).
Bulk density was directly assigned by oxidation type and rock type:
MMA/Mafic/Ultramafic/Dolerite Fresh = 2.9 t/m3 Transitional = 2.2 t/m3 Oxide = 1.8 t/m3 Fresh Quartz = 2.5 t/m3 Transported/Laterite = 2.1 t/m3 Pit Backfill and Surface Dumps = 1.8 t/m3 |
| Classification |
Factors considered when classifying the model include:
The portions of the 2023 MRE classified as Indicated are typically based on drill spacing less than or equal to 30 m x 30m. This drill spacing is appropriate for defining the continuity and volume of the mineralised domains and estimating robust global Mineral Resources. Approximately 85% of the Indicated portion of the Sept 2023 MRE has been drilled at closer then 30m x 30m and 70% of the Indicated portion has been drilled at better than 24m x 24m.
The portions of the Sept 2023 MRE classified as Inferred typically represent peripheral areas of the deposit where geological continuity is present but not consistently confirmed by 30 m x 30 m drilling or closer.
Further considerations of resource classification include; data type and quality, geological understanding, amount of historical development and stoping, and historical and recent production reconciliation performance.
The Mineral Resource classification appropriately reflects the view of the Competent Person.
|
| Audits or reviews |
The geological interpretation, estimation parameters and validation of the resource model was peer reviewed by Catalyst staff.
No external reviews of the resource estimate had been carried out at the time of writing.
|
| Discussion of relative accuracy/ confidence |
The relative accuracy of the Mineral Resource estimate is reflected in the reporting of the Mineral Resource as per the guidelines of the 2012 JORC Code.
The statement relates to the global estimates of tonnes and grade.
The estimation method adopted for the Sept 2023 MRE is believed to be appropriate for dealing with the high-degree of grade variability at Plutonic.
The estimated uncertainty for an Indicated Mineral Resource is typically +/- 20% over an annual production period.
In most cases it is considered that only development/face sampling in conjunction with <10m x 10m drill spacing is sufficient to attain enough confidence for stoping.
|
Section 4 Estimation and Reporting of Ore Reserves
Plutonic Underground Deposit
(Criteria listed in section 1, and where relevant in sections 2 and 3, also apply to this section.)
| Criteria |
Commentary |
| Mineral Resource estimate for conversion to Ore Reserves |
The Mineral Resource Estimate (MRE) is defined as the December 2023 release (ASX Release - 'Plutonic and Trident Mineral Resource & Ore Reserve Update' 6th December 2023). Plutonic 2023 MRE Measured 0Mt's @ 0g/t for 0koz. Indicated 17.2Mt's @ 2.9g/t for 1,592koz. Inferred 0.7Mt's @ 2.6g/t for 62koz. The December 2023 MRE was depleted of mined voids (stopes and development) up to end of June 2024. This depleted MRE formed the basis of the 2024 ORE. The ORE is subset of the Measured and Indicated MRE and is spatially contained within the MRE. |
| Site visits |
The Competent person is a full-time employee of Catalyst Metals who has visited the Plutonic Underground Mine site on a regular basis for the past 9 months. The competent person has 23+ years in Western Australian underground mining and mine planning practises with detailed knowledge of mining methods, current industry costs, schedule constraints and other material parameters relating to compiling an Ore Reserve Estimate. |
| Study status |
The Ore Reserve has been determined based on the current operational practises of the Plutonic underground mine. Plutonic has been in production as an underground operation since 1995. The Ore Reserves were estimated using Deswik software and reported against the 2023 MRE block model. Stope optimiser shapes were created (using minimum mining widths and heights – see "Mining factors or assumptions" for details), with additional modifying factors applied within the scheduling phase to accommodate planned and unplanned dilution / ore loss factors. Stope shapes and development ore were then assessed (post applying all forms of modifying factors) for economic viability using an operating cut-off grade value (COG). Additionally, the entire ORE was economically assessed over the scheduled life to accommodate capital and time dependent cost factors. Previous operational performance has demonstrated that the current mining methods are technically achievable and are economically viable. The modifying factors used in the Ore Reserves calculations are based on historically achieved mining dilution and recovery factors. The current mine plan and mining method used currently will continue for future mining. |
| Cut-off parameters |
Stope optimiser shapes were initially categorised by using the operating cut-off grade (1.5g/t). Subsequently, stope shapes that were spatially distant from the mine's footprint were deleted to filter inventory requiring excessive development costs to access. The operating cut-off grade applied to the Ore Reserve Estimate was :
1.5g/t for stope shapes (after all forms of dilution and ore loss)
1.0g/t for ore development shapes (after applying development profiles to the ore boundary)
Cost and modifying factors used to determine the above COG's were:
Direct underground operating (mining and geology) A$ 59.0/ore t
Processing A$ 27.4/ore t
Site G&A A$16.7/ore t
Corporate Overhead A$2.6/ore t
Surface Haulage A$0.0/ore t (direct cart)
Metallurgical Recovery 86.5%
Royalties WA State 2.5% NSR
A gold price of A$2,700/oz was used in the assessment.
|
| Mining factors or assumptions |
The Ore Reserves estimate is reported within an underground Shape Optimiser (SO) evaluation from the June 2024 depleted MRE model.
SO input parameters include a 1.5 g/t Au cut-off, minimum mining width 3m, minimum stope length of 5m, stope height of 5-25m and a gold price of A$$2,700/oz. The orientation of SO's is variable depending on the geometry of the mineralisation The Ore Reserves estimate is based on long-hole open stoping, the mining method currently applied at Plutonic Underground. If a stope can be back-filled with waste rock, it will be filled. Plutonic has been in operation for 29 years, whereby various mining methods have been used in the past (room and pillar, LHOS with paste fill/ rock fill or no fill) The historic voids have been incorporated into the MRE and coded to ensure the method of fill determines proximity of stope shape generation. Unclassified and Inferred material have not been included within the Ore Reserves, however if the material is mined as a consequence to mining an Ore Reserve estimated stope, then material had a zero-grade assigned and was therefore treated as waste. The Modifying factors are validated via a routine reconciliation process. Mining dilution of 25% is applied to the in-situ stope optimiser (SO) ore tonnes and ore recovery of 90% is applied. Development had no dilution applied and 100% mining recovery assumed. To illustrate the scale modifying factors have on the ORE, the below grade bins have been calculated from the total stope ORE inventory of 6,779,650t's @ 2.6g/t for 560.4koz mined:
Stope tonnes 0.5g/t – 2,429,000 t's
Stope tonnes 0.5-1.5 g/t – 822,000 t's
Stope tonnes > 1.5 g/t – 3,528,000 t's
On this basis, the level of dilution applied to, and within, the SO shapes is deemed appropriate to represent final / executable stope design shapes and cost estimates are based on actual site operating data and engineering estimates. |
| Metallurgical factors or assumptions |
The Plutonic Gold Mine has been in operation since 1990. The original process plant ("PP1") consisted of an open circuit jaw crusher, coarse ore stockpile, semi-autogenous grinding ("SAG") mill and ball mills, two leach tanks, and six carbon adsorption tanks. A three-stage hard rock crushing circuit was incorporated in 1994 which included a fine ore bin and an additional ball mill. A second process plant ("PP2") was added in 1996 utilising the original PP1 jaw crusher and coarse ore stockpile and adding SAG and ball mills, two additional leach tanks and six additional carbon adsorption tanks. A 16 MW gas power station was added in 1997 and upgraded with new sets in 2014 and 2020 respectively. PP1 was designed for the treatment of primary ore while PP2 was designed to process oxide ore. At the end of June 2004, oxide ore sources were exhausted and the crushing and milling components of PP2 were shutdown. However, the leach and carbon adsorption circuit of PP2 was run in parallel with the PP1 leach/adsorption circuit. In April 2008 the PP2 leach and carbon adsorption circuit was emptied, cleaned, and placed into care and maintenance as part of a strategy to reduce the site power load and power consumption due to power restrictions caused by the June 2008 gas supply crisis. The four tanks in the PP2 leach and carbon adsorption circuit that were re-commissioned in June 2010 were shut down in 2012. Plant performance for the past five years displays consistent performance, with recoveries ranging from 80% to 90%, and an average recovery in 2023-24 of 86.5%. Metallurgical recoveries used to generate the Mineral Reserves were based on site production data and detailed metallurgical testing to an appropriate standard. Plant performance for the past five years indicates reasonable performance, with recoveries ranging from 76% to 90%, and an average recovery in 2023-24 of 86.5%. Metallurgical recoveries used to generate the Mineral Reserves were based on site production data and detailed metallurgical testing to an appropriate standard. |
| Environmental |
Mining licences / permits are currently granted for Plutonic ORE. Licences / permits include:
Department of Water and Environmental Regulation (DWER) Works Approvals. DWER licenses water abstraction and pollution discharge activities.
DEMIRS Mining Proposal and Mine Closure Plans (or historical Notice of Intent – NOI). The Department of Mines, Energy, Industry Regulation and Safety ("DEMIRS"). DEMIRS administers and regulates the activities of the mining industry under the provisions of the Mining Act.
Native Vegetation Clearing Permit ("NVCP") under Part V of the EP Act and the Environmental Protection (Clearing of Native Vegetation) Regulations 2004.
Ground Water Licences - The abstraction of groundwater for water supply and/or mine dewatering purposes requires licences to be issued by the DWER (Water Section) under section 5C of the Rights in Water and Irrigation Act 1914 (the "RIWI Act").
Activities undertaken onsite are required to be undertaken in accordance with the above environmental approvals. Monitoring programs are conducted to ensure that key approval and licence requirements are complied with. |
| Infrastructure |
The Plutonic Gold Mine is a well-established mine which has services and infrastructure consistent with an isolated operating mine. The existing site infrastructure can support the current mine plan, as historically the site has successfully operated at production rates significantly higher than those envisaged |
| Costs |
Capital costs are based on current costs at Plutonic Underground, recent quoted assets and / or a budget level cost model. Operating costs are derived from the operating Plutonic Underground using current costs and budget models. Allowances have been made for State royalties (2.5%) payable on net revenue. Surface transport cost based on contracted or quoted rates. Treatment costs reflect the operating Plutonic Processing Plant. Cost models use Australian Dollar. |
| Revenue factors |
The Ore Reserve Estimate is generated at $A2,700/oz. |
| Market assessment |
Gold metal is a freely and widely traded commodity with a transparent mechanism for setting prices and for sale of gold produced. Doré is sold direct to the Perth Mint at spot price or used to fill hedging obligations. Catalyst has not conducted any studies or analyses such as commodity price projections, product valuations, market entry strategies, or product specification requirements. |
| Economic |
The Plutonic operation is economically robust and generates positive cashflow using the afore mentioned costs, revenue factors and discount rate of 7%. |
| Social |
Catalyst continues to engage with stakeholders of the operation – local community, native title owners, Shire members and pastoralists. Catalyst is committed to strong environmental and social performance. There are no identified threats that place the company's social licence to operate at risk. |
| Other |
No material risks or impacts are identified. |
| Classification |
The Ore Reserves classification reflects the Competent Person's view of the deposit. Only Probable reserves have been declared and are based on Indicated Resources following consideration of appropriate modifying factors. No Proven Ore Reserves were derived from Measured Resources. |
| Audits or reviews |
No reviews or audits have been conducted on the Ore Reserve Estimate. |
| Discussion of relative accuracy/ confidence |
Plutonic Gold Operations is an operating, owner operated site – with a current 1.2Mtpa underground mine and 1.8Mtpa process plant. Planning and assessment of Plutonic East ORE are aligned to this operating model. |
APPENDIX 2
PLUTONIC EAST – JORC CODE, 2012 EDITION – TABLE 1
Section 1 Sampling Techniques and Data
Plutonic East Deposit
(Criteria in this section apply to all succeeding sections.)
| Criteria |
Commentary |
| Sampling techniques |
The Plutonic deposit has been sampled using numerous drilling and sampling techniques by Billabong Gold Pty Ltd (Billabong - 100% owned Catalyst Metals Limited) and previous operators. Drilling and sampling techniques by previous operators is assumed to be to industry standard at that time.
The drilling database underpinning the Mineral Resource Estimation (MRE) for Plutonic East is based on diamond drilling (DD) from surface and underground platforms, underground rock chip face samples (FS) and Reverse Circulation (RC) drilling.
For DD samples, downhole depth is recorded by the drillers on core blocks after every run. This is checked and compared to the measurements of the core by a geologist to honour geological boundaries (lithology, mineral assemblage, alteration etc). Sample lengths typically vary between 0.3m and 1.0m.
DD core is orientated using a Reflex ACT device and detailed structural measurements and logging is carried out. Exploration DD core is sawn in half along the orientation lines, with half the sample being submitted for assay and the remaining half being retained for reference. Grade control DD core is whole core sampled and sent for analysis.
RC samples were collected for each metre drilled and passed through a cyclone and riffle splitter to produce a two kg to four kg assay into calico bags.
FS samples are completed by the mine geologists. The sampling is taken by chipping the face into calico bags with definition by lithological boundaries. FS samples are taken perpendicular to the lode orientation in the face. The face sample locations are marked up and measured from fixed survey points.
|
| Drilling techniques |
Diamond core diameters include BQ (36.4 mm), BTW (42 mm), LTK60 (43.9 mm), NQ (47.6 mm), NQ2 (50.7 mm).
RC holes were drilled with face hammers and were sampled at one metre down hole intervals.
|
| Drill sample recovery |
DD recovery is not noted specifically, though core is though the core is jig sawed back together and meter marked carefully. Discrepancies to core blocks are brought up with the drill contractor. Occasionally core loss blocks are inserted. Overall drill core recovery is very good.
Billabong diamond drilling practice results in high core recovery due to the competent nature of the ground.
Chip sample recoveries are not relevant in this instance.
RC and DD by previous operators is assumed to be to industry standard at that time.
There is no known relationship between sample recovery and grade; diamond drill sample recovery is very high.
|
| Logging |
DD core, RC samples and FS chip samples have been logged by qualified geologists to a level of detail to support appropriate Mineral Resource estimation, mining studies and metallurgical studies.
Logging and face mapping is qualitative and quantitative. Visual estimates of sulphide (percentage) and alteration (intensity scale) are recorded. Core Logging and face mapping notes lithology, alteration, mineralisation and structures. Structural readings are taken at relevant structures and where the foliation is relatively consistent.
All DD core is digitally photographed and logged. Faces are mapped and sampled when access permits.
|
| Sub-sampling techniques and sample preparation |
If the DD core was BQ, LTK48 or BTW it was sampled as full core and dispatched to the laboratory for analysis. Most LTK60 and NQ2 DD core is cut in half with an Almonté diamond core saw; the top half of the core was sent to the laboratory for analysis and the other half was placed back in the core tray, transferred onto pallets, and moved to the core yard library. All GC drilling, regardless of core size, is whole core sampled.
RC samples were collected for each metre drilled and passed through a cyclone and riffle splitter to produce a two kg to four kg assay into calico bags. Depending on the oxidation state of the rock, the sample weight varied between three and five kilograms. A duplicate sample was also collected and retained in a temporary sample storage facility for further check sampling. The RC drilling and sampling were supervised at the drill site by a company sampler and geologist. The riffle splitter was cleaned using compressed air after every sample and the cyclone was cleaned every 40 m, or more regularly at the geologists' discretion. Wet or damp RC samples were allowed to dry before riffle splitting.
FS chip samples are taken by chipping the face into calico bags with definition by lithological boundaries.
Sample preparation procedures for DD and FS includes:
1-4 hours drying at 150°C depending on moisture content;
Crush 85% < 3mm – Essa jaw crusher or rotary Boyd crusher;
Riffle split 50:50 to<1kg;
Pulverise ~700-750g to 90% passing 75μm in Labtechnics LM2;
Scoop 250-300g;
Scoop to subset to 40gm for fire assay.
Quality control procedures for DD and FS includes:
FS – blanks added to each face sample with ore zones;
DD –barren wash and blanks added after each ore interval;
Crusher duplicates taken at 1:40;
Pulp duplicates taken at 1:40.
Sample preparation protocols and sample sizes are considered appropriate for the style of mineralisation encountered and should provide representative results.
|
| Quality of assay data and laboratory tests |
The Plutonic Gold Mine has been in operation since 1990 following discovery in 1988. QAQC procedures have changed throughout that period. The current underground Mineral Resources have been identified over a long period of time with a number of companies. All high confidence Mineral Resources are based dominantly on underground DD and FS completed in the last 14 years.
In recent years, for DD, and FS, gold concentration is determined by fire assay using the lead collection technique with a 40gm sample charge weight. An AAS (Plutonic lab) or ICP (ALS and Bureau Veritas) finish.
A Pulverising and Leach (PAL) method was introduced to the Plutonic site laboratory in 2005. Underground GC samples are initially assayed by PAL and where the result is greater than 0.5 g/t Au the sample is re-analysed by 40gm fire assay and the fire assay result is retained for grade estimation purposes. It has been shown that the use of PAL assays is likely to have negligible influence on the MRE.
Although PAL is not considered to be a total gold analysis, the larger sample size still produces a representative result. Fire assay gold analysis is considered to be total gold.
Samples are dried, crushed and pulverised prior to analysis.
Certified Reference Material (CRM's) are submitted every 20 samples for DD and once per shift for FS (approx. 1 in 15 samples). CRM's are of similar grade tenor to those expected in the sampling. The CRM insertion rate ensures that there are at least two CRM's per assay batch. CRM's are selected based on their grade range and mineralogical properties with an emphasis on sulphide ores.
Blanks are inserted every 20 samples for DD and for FS they are inserted after any face that contains mineralisation.
Grind checks or sizing was carried out on a frequency of 1 in 40 on both pulp residues and crush residues prior to January 2020. Since January 2020, crush sizing analysis is conducted randomly. The data is collected throughout the shift with results calculated at the end of shift. Pulp residues are expected to have 90% passing ≤75μm. The crush residue is expected to have 80% passing ≤3 mm. This data is monitored by the Laboratory Supervisor. Grind times can be lengthened accordingly.
Field, crush and pulp duplicates, occur at a frequency of 2.5%.
Current procedures dictate a process of validation and checking of laboratory results when data is returned by the laboratory as it is loaded into the acQuire database. A standard set of plots and checks are undertaken, and if results fall outside of the expected limits, then re-assaying is requested. Monthly QAQC reports are generated by the database administrator and documented from automated routines out of the database.
A comprehensive review of the QAQC results was undertaken for both the 2022 and 2023 MRE updates of the Plutonic Underground by Superior Gold and Cube Consulting respectively.
Conclusions from the 2022 review include:
Overall performance of the Plutonic site and external laboratory (ALS) are adequate for estimating and reporting Mineral Resources for the Plutonic underground operations despite some minor shortcomings in the site laboratory;
The accuracy of the laboratories is within 3% error;
The variance of the laboratories (precision) based on CRM's is acceptable for underground production purposes;
Both ALS and Plutonic laboratories performed well on precision and accuracy with ALS lab slightly better precision;
Coarse duplicates revealed relative errors at 20% for samples with Au >7 g/t and 30% relative errors for samples with Au between 3 and 7 g/t;
50% of the errors of the coarse duplicates may have been caused by a coarse gold nugget effect. The remaining errors were likely caused by contamination, other laboratory procedure breaches and human error.
At the Plutonic Laboratory there was:
some low-level contamination at crushing stage;
some minor procedural non-compliance at crushing, pulverising, and instrument assaying stage;
periodic increased assaying uncertainty may be caused by possible human errors;
the extent of the laboratory contamination is unknown given the random nature of the blank insertion;
upper limit for blanks of 0.2 g/t is too high to effectively detect contamination.
At ALS Laboratory there was:
there was insignificant contamination at the lab during the period;
the laboratory has performed consistently well;
laboratory precision test on CRM's indicated a better performance than CRM manufacturer.
Conclusions from the 2023 MRE Competent Person include:
Results indicate that the QAQC performance is sufficient for using the data for an underground Mineral Resource Estimate;
Element of risk in using PAL due to incomplete digestion;
Site laboratory performance (the majority of the samples) is poorer than off-site labs (ALS and Bureau Veritas) – contamination and percentage of CRM failure;
Site laboratory shows poorer performance at low levels of Au (0.4 - 0.8 g/t), but effect on underground Mineral Resources likely to be minimal;
Precision of
CRMs for site laboratory poorer than manufacturer.
No review of the
QAQC results at Plutonic East were undertaken by CYL during this MRE.
|
| Verification of sampling and assaying |
DD, RC and face logging is completed electronically on laptops. Database protocols and rules are applied upon data entry.
Visual validation and check logging of face and drill data.
Drill and face sample data is stored in an AcQuire database. All maintained full-time Database Administrator.
All face and drill data within site databases are regularly validated using both internal database systems and external validation tools.
Validation of pre-Billabong data is completed periodically.
There is no requirement for twinned holes in a production setting.
Conversion of lab non-numeric codes to numeric for estimation.
|
| Location of data points |
UG hole collar locations are picked up regularly by site surveyors.
Multi shot cameras are used for down-hole survey.
Development faces are spatially located using MineMapper and Vulcan 3D software.
Underground development voids are picked up regularly by site surveyors. Stopes voids are generally all surveyed by CMS (where practical and safe to do so).
|
| Data spacing and distribution |
Plutonic East underground Mineral Resources are primarily based on DD, RC and FS data.
Given the high degree of grade variability and spatial complexity at Plutonic East (extremely high nugget effect and minimal short-scale spatial continuity), it is difficult to generate local scale grade estimates that would adequately satisfy a Measured Resource classification. For this reason, no Measured material has been included in the June 2024 MRE. Indicated Resources can be reasonably well-defined with DD spacing up to 20m × 20m. Average data spacing for Indicated resources for the MRE is within 10m x 10m. Inferred resources are assigned to areas where DD spacing is generally greater than 20m × 20m.
Grade control DD spacing typically required for stope definition is between 8m × 8m to 10m ×10m. Close spaced FS are also used for stope definition.
The data spacing and distribution is sufficient to establish geological and/or grade continuity appropriate for the Mineral Resource and classifications to be applied, with known likelihood of local variability.
The drill core is logged and divided into sample intervals that have a minimum sample length of 0.3m and a maximum sample length of 1.0m. Intervals should honour geological boundaries such as faults and lithological contacts. Most nominal sample lengths were at 1m intervals; sample compositing is not applied until the estimation stage.
Compositing of the data to 1m was used in the estimate.
No recent RC drilling has been undertaken
|
| Orientation of data in relation to geological structure |
Drilling is orientated as close to perpendicular to mineralisation where possible. However, orientation to lode may be compromised by access to suitable drill platforms. Drillholes are extended to Mine Mafic boundary where required and practicable.
Face sampling is orientated perpendicular to lode orientation.
The variable drill orientation relative to mineralisation is not thought to make a material difference in the resource estimation.
|
| Sample security |
All cut drill core is kept in an unfenced core farm adjacent to the core cutting and processing shed. This is not regarded as a security risk due to the remote location of the mine with no community development near the mine. All core is photographed and records kept electronically.
Geologists are responsible for marking the sample intervals and placement of Blanks and Standards within the sampling stream for both faces and core. The Project Geologist and Senior Geologist complete quality control checks on the face data daily.
Field Staff are primarily responsible for the collection of samples from the face as chips, as well as the cutting and sampling of core. Also generating the sample numbers for core submission, creating a sample submission sheet for core and faces, randomly selecting and recording the standards to be sent to the laboratory and the transportation of the samples to the laboratory.
Once a hole has been sampled, the sample calculation and check geology documents are handed to the Database Administrator (DBA) who converts the digital copy of the sample calculation to a .csv file which is then imported into the AcQuire database.
Upon receiving the digital file for the assay data, the DBAs import the file into the master AcQuire database. This data is not accessible for assessment until it has been validated as complete and correct by the QAQC Geologist and DBA. Face data is received in the same format and is entered into the AcQuire database.
Pulp rejects from assayed samples are kept in wooden boxes on top of the waste dump. These are visited frequently as samples are taken for research and other purposes.
Drill logs are kept in hard copy and electronically and are available for checking and due-diligence.
|
| Audits or reviews |
A review by Jacqui Coombes (Coombes, 2009) concluded that it was reasonable to combine the drillhole and face sampling data for the Plutonic deposit – report sighted.
A previous review by Roscoe Postle and Associates (RPA) in 2012 concluded that the data verification systems were adequate for Mineral Resource estimation.
Previous estimation process review by Optiro (2015) identified that reduced manning levels were having an impact on the quantity and quality of the data being generated in 2015, however, overall, the data collection systems which support the Mineral Resource estimation process were found to be best practice – report unsighted.
In 2022, SnowdenOptiro completed a technical review of the 2022 Plutonic Underground Mineral Resource Estimate prior to a public release. This report indicated some concerns about smearing of high grades into low grade areas, the assignment of Measured and Indicated resources in areas of low data density and the lack of a reconciliation analysis against the estimate.
No external audits or reviews have been undertaken on the June 2024 Mineral Resource Estimate.
|
Section 2 Reporting of Exploration Results
Plutonic East Deposit
(Criteria listed in the preceding section also apply to this section.)
| Criteria |
Commentary |
| Mineral tenement and land tenure status |
The Plutonic Gold Mine group includes 30 granted exploration and mining tenements (24 mining leases, 2 exploration licences, and 4 prospecting licences) (as such term is defined in the (Western Australian) Mining Act 1978 (the "Mining Act"))
All rents to Department of Mines, Industry Regulation and Safety ("DMIRS") have been paid and made within one month after the anniversary commencement date of the tenement as allowed under the Mining Act.
All tenement Shire rates have either been paid or will be paid within the required timeframes.
All compliance reporting including Form 5 Reports, have been lodged within the timeframes allowed under the Mining Act 1978 as amended.
All Geological Reports have been lodged.
There are no other unexpected encumbrances registered or recorded against the tenements.
There are no Forfeiture proceedings against any tenements.
|
| Exploration done by other parties |
1969-1976 – International Nickel Company (Inco) conducted nickel exploration using geochemistry, geophysics, costeaning, RAB and RC drilling.
1987 – Great Central Mines (GCM) identified an arsenic and gold anomaly by geochemical sampling in the Plutonic tenements.
1987-1993 – Battle Mountain Australia (BMA) undertook regional mapping, Bulk Leach Extractable Gold (BLEG) soil sampling, and RAB drilling. The Triple P, Pelican, Albatross and Flamingo deposits were discovered in 1992. Further RAB, AC, RC and DD programs were conducted to define these deposits.
1988-1994 - Resolute Resources Ltd (75%) and Titan Resources NL (25%) commenced exploration on the Marymia tenements. Gold mineralisation was discovered in the Keillor Shear Zone following regional exploration soil, stream sediment and rock chip sampling and geological mapping. Several phases of follow-up RAB, AC, RC and DD drilling was carried out. K1 deposit was discovered in 1989. Prospect scale geophysical surveys including magnetics and gradient array IP were undertaken between 1989 and 1994.
1990 – GCM carried follow up grid-based mapping, soil and lag geochemical surveys which led to the discovery of the Plutonic deposit.
1990 – GCM discovered satellite deposits at Area4 and Channel. Both were mined by open pit between 1999 and 2001.
1990-1995 – Plutonic Resources exploration division carried out exploration on the Freshwater tenements and discovered a total of 1 underground and 30 surface prospects. Follow up resource definition drilling resulted in conversion of these prospects to 10 open pits and one underground mine, including Area 4 open pit, Plutonic East underground deposit, Salmon, Trout and Perch.
1999-2004 - Homestake Gold of Australia undertook a detailed aeromagnetic and radiometric survey over the entire lease area. Additional IP and moving loop geophysical surveys were undertaken between 2000 and 2004 across several prospects. The largest of which was across the K1-K2 project area in 2004.
2004 - the Plutonic Development department undertook a large soil sampling programme over the northwestern end of the Marymia tenements, in conjunction with the IP survey. These surveys identified a number of targets that were followed up with some additional surface geochemical sampling.
2001-2007 - exploration and resource definition drilling by RAB, RC and diamond core drilling was undertaken by the Plutonic Development department across numerous prospects outside of the Plutonic Mine area. Many of these drilled prospects were proven up to become small satellite open pit mines such as Triple P B-Zone, Albatross, Flamingo, Kookaburra, Ibis, Piranha, to name a few.
2009-2012 - RC and diamond core drilling concentrated on extensions to the known Plutonic deposit. Outside of this area two 2D seismic lines were shot in conjunction with
Curtin University and diamond core drill was undertaken at Plutonic West and Cod prospects.
|
| Geology |
The gold deposits at Plutonic are hosted by an Archaean greenstone sequence and occur mainly as a multiple lode system with variable dip (horizontal to vertical) hosted almost exclusively by a mafic amphibolite sequence that is referred to as the 'Mine Mafic'.
Mineralisation regularly occurs as shallowly dipping, layer parallel lodes, although steep lodes and minor quartz-vein hosted deposits also occur. Mineralisation at Plutonic is characterized by a series of moderately-dipping to very flat-lying, stacked replacement-style lodes, individually up to five metres wide, that are hosted within ductile shear zones, oriented slightly oblique to stratigraphy.
|
| Drill hole Information |
No exploration results are being reported as part of this
MRE update.
|
| Data aggregation methods |
No exploration results are being reported as part of this MRE update.
|
| Relationship between mineralisation widths and intercept lengths |
No exploration results are being reported as part of this MRE update.
|
| Diagrams |
No exploration results are being reported as part of this MRE update.
|
| Balanced reporting |
No exploration results are being reported as part of this MRE update.
|
| Other substantive exploration data |
No additional exploration data is included in this release.
|
| Further work |
Grade control and extensional drilling programs are underway, and will continue in line with mine development and production requirements.
|
Section 3 Estimation and Reporting of Mineral Resources
Plutonic East Deposit
(Criteria listed in section 1, and where relevant in section 2, also apply to this section.)
| Criteria |
Commentary |
| Database integrity |
The Plutonic East MRE database is regularly validated by Catalyst staff using data validation modules of Vulcan, Leapfrog and AcQuire software programs to identify any inconsistencies or logical errors in the data. Mine staff also visually check the drill hole data on-screen on a regular basis.
Surface and underground drill hole and face data is validated to produce a digital database free of detected errors. This is undertaken by passing data through embedded macros and queries of the drill hole database software by table (collar, assay, lithology, survey, and grout).
Crosschecks are also undertaken to ensure that each drill hole has data from collar, assays, lithology, survey, and grout files. By undertaking the above procedures, all drill hole and face data is rigorously checked, verified, and corrected where necessary to ensure limited failures.
The Plutonic East database bounded by an area of >=7000 and <=11,500 East and >=9500 and <=12,500 North available on May 17 2024 comprised 14,140 Collar records, 31,594 Survey records, 429,876 Assay records and 102,549 Lithology records. The compiled database used for resource estimation comprised 12,738 Collar records, 38,970 Survey records, 412,318 Assay records and 95,403 Lithology records.
|
| Site visits |
The Competent Person undertakes frequent site visits to the Plutonic Gold Operation and associated
Marymia tenements.
|
| Geological interpretation |
The confidence in the geological interpretation is high with all the information and over 30 years of open pit and underground operation used in the generation of the models.
All available geological data was used in the interpretation, including drilling face sampling and mapping.
The modelling approach takes advantage of many thousands of structural measurements from orientated diamond holes and underground development faces to build structural trend surfaces, and uses these trend surfaces to determine the mineralisation trend in domaining and grade estimation.
Mineralisation regularly occurs as shallowly dipping, layer parallel lodes, although steep lodes and minor quartz-vein hosted deposits also occur. Plutonic style mineralisation is characterised by a significant population of high to extreme gold grades that demonstrate very poor spatial continuity (only a few meters at best). These high-grade populations tend to occur in 'clusters' or cohesive zones on a large scale, however, the actual spatial continuity is very poor at a local scale, making it difficult to define robust zones of continuity without introducing significant bias
|
| Dimensions |
Mineralisation extends over a strike length (East – West) of approximately 1400 m and down-dip up to 600 m. Mineralisation currently extends to a depth of approximately 400 m below surface.
|
| Estimation and modelling techniques |
Gold mineralisation at Plutonic East exhibits very similar style and spatial behaviour to that observed at the Plutonic mine located approximately 4km to the west. Indeed, the bulk of Plutonic East mineralisation is hosted in the same Mine Mafic (MMA) unit that hosts almost the entire Plutonic deposit.
Approximately 94% of economic gold mineralisation at Plutonic East is hosted within the Mine Mafic Unit (MMA). Plutonic East mineralisation is characterised by a significant population of high to extreme gold grades that demonstrate very poor spatial continuity (only a few meters at best). Raw Coefficients of Variation (CoV) are typically in the order of 8 to 27, indicating extreme statistical variability.
The estimation approach adopted for Plutonic East was identical to that used for the November 2023 Plutonic MRE. Four primary domains were separately estimated for Plutonic East:
Mine
Mafic Unit (MMA-1000)
Upper Ultramafic Unit (UM1 – 2000)
Lower Ultramafic Unit (UM2 – 3000)
Overthrust Mafic Unit (OTM – 4000)
Given the similarities to the nearby Plutonic mine, most of the estimation parameters were applied as the average of parameters used for the November 2023 Plutonic MRE.
The estimation method developed for the MRE combines Categorical Indicator Kriging (CIK) to define broad estimation domains, together with applying distance limiting at chosen grade thresholds to restrict the influence of the high grade and extreme grade values during grade interpolation.
Prior to estimation, a closely spaced set of structural surfaces are developed in LeapFrog reflecting the primary controls on mineralisation within the primary lithological units. A dip and dip-direction of each triangle facets is imported into the Surpac block model to provide information for dynamic search and variogram model orientation during grade interpolation. Dynamic estimation is applied for estimating the CIK indicators and gold grades.
All DD and FS data are composited to 1m downhole and data within dolerite dykes or vein zones are removed. Composited data was split into the eight mine areas.
Two Categorical Indicator values are determined for each mine area:
A low-grade (LG) indicator to differentiate between background 'waste' and low-tenor mineralisation – 0.5 g/t Au.
A high-grade (HG) indicator to define broad areas of higher-tenor mineralisation – 1.4 g/t Au.
Indicator variograms were modelled for the LG and HG thresholds for all mine areas. The indicator variograms for both grade thresholds exhibited a moderate nugget effect and demonstrated well-structured continuity up to 30m. The CIK indicators were estimated using Ordinary Kriging into a finely gridded block model with block dimensions of 1.25m x 1.25m x 1.25m. The small block size for the indicator process is beneficial for creating categorical sub-domains at resolution which can be used to accurately back-flag composite data.
Three categorical sub-domains were generated for low-grade (LG), medium-grade (MG) and high-grade (HG) areas. The HG sub-domain was based on an indicator probability threshold of 0.35 and the LG sub-domain was based on an indicator probability threshold of 0.65. The MG sub-domain is assigned to blocks that do not satisfy either the HG or LG sub-domain criteria.
The three categorical block model sub-domains (HG, MG and LG) were used to 'back-flag' the 1m composites from each mine area, thus creating a separate composite file for each sub-domain.
Standardised assay top-cuts are applied to the composite files for each domain area as follows:
The assay top-cuts were generally above the 99th percentile of the distribution and were aimed at globally limiting extreme values only. Top-cuts are not used as the primary tool to control metal risk. The use of grade thresholds and distance limiting is considered a more objective and influential method in controlling metal risk, while better reflecting the actual localised occurrence of discontinuous high-grade gold mineralisation.
Given the similar spatial characteristics of mineralisation between Plutonic East and the Plutonic Mine, it was decided to use average grade variogram values modelled for the LG, MG and HG sub-domains for all mine areas from the Plutonic November 2023 MRE.
The HG grade variograms exhibited a very high nugget effect (average 79%) with maximum ranges of only a few meters (average 3.4m). Grade variography undertaken on the HG domain confirms the extremely variable nature of Plutonic and Plutonic East mineralisation. Grade variography on the MG and LG domains resulted in lower nuggets effects and longer ranges.
Grade thresholds for distance limiting were also applied using averages from the Plutonic November 2023 MRE. Grade thresholds and distance limits from the Plutonic November 2023 MRE were optimised following a detailed backward-looking mill reconciliation using mine stope voids for the period January 2023 to August 2023 (550Kt).
The final applied grade distance limits for Plutonic East are follows:
0-8 g/t = No Limit 8-70 g/t = 10m >70 g/t = 5.5m
Prior to grade estimation, sub-domain codes from the 1.25m resolution block model are imported into a 2.5m x 2.5m x 2.5m resolution model and the proportion of LG, MG and HG is calculated for each 2.5m block. Grade estimation for the LG, MG and HG domains was undertaken in Surpac software using Ordinary Kriging with grade threshold distance limiting. Kriging Neighbourhood Analysis (KNA) was undertaken to assist with defining estimation parameters. Search routines and variogram orientations are drawn from the pre-populated dynamic search information recorded in each block.
Final block grades at a 2.5m block resolution were calculated by weighting the estimated grades for each sub-domain by the relevant domain proportion.
The parent estimation block size was 2.5m x 2.5m x 2.5m. A minimum of 3 and maximum of 12 (1 m composite) samples per block were used. It is possible that up to 36 composites can be used to estimate a parent block where there is a proportion of all three sib-domains present. Block discretisation was set at 3 E x 3 N x 3 RL points (per parent block).
A standardised search ellipse of 25m x 25m x 6.25m was used. Octant restrictions were not used.
Typical data spacing varied from 3m x 3m to >40m x 40m.
The model was validated by comparing statistics of the estimated blocks against the composited sample data; visual examination of the of the block grades versus assay data in section; swath plots; and reconciliation against previous production.
|
| Moisture |
All estimations were carried out using a 'dry' basis.
|
| Cut-off parameters |
Plutonic East Mineral Resources are reported at a cut-off grade of 1.5 g/t Au. The cut-off grade has been derived from current mining and processing costs and metallurgical parameters.
|
| Mining factors or assumptions |
The Plutonic East Mineral Resource estimate is reported within an underground Shape Optimiser (SO) evaluation from the undiluted and depleted resource model. SO input parameters include a 1.5 g/t Au cut-off, minimum mining width of 2.5m, minimum stope length of 5m, minimum stope height of 5m and a gold price of AUD$3,200/oz.
The orientation of SO's is variable depending on the geometry of the mineralisation
|
| Metallurgical factors or assumptions |
It is assumed the material will be processed at the Plutonic Gold Plant. Recovery factors are assigned based on-going experience.
No metallurgical modifying factors or assumptions have been built or applied to the resource model
|
| Environmental factors or assumptions |
The Plutonic underground operation is a going concern and as such previous practices have proven to be effective and practical.
A conventional storage facility is used for the process plant tailings.
The small amount of waste rock is stored in a traditional waste rock landform 'waste dump'. Due to low sulphide content and the presence of carbonate alteration the potential for acid drainage formation is considered to be low
|
| Bulk density |
Bulk density is determined from drill core using a weight in air/weight in water method. Currently there is a database of over 3,800 bulk density measurements which have been taken from mineralised and unmineralised intervals, with an ongoing sampling program in place.
Samples of between 0.5 and 2.0kg are weighed in air and weighed in water. The following equation is used to derive bulk density Bulk Density = Wd / (Wd−Ww).
Bulk density was directly assigned by oxidation type and rock type:
MMA/Mafic/Ultramafic/Dolerite
Fresh = 2.9 t/m3
Transitional = 2.2 t/m3
Oxide = 1.8 t/m3
Pit Backfill and Surface Dumps = 1.8 t/m3
|
| Classification |
Factors considered when classifying the model include:
Due to the high degree of grade variability and short-scale continuity of mineralisation, the portions of the MRE classified as Indicated are typically based on data spacing (DD and FS) less than or equal to 15m x 15 m and located within close proximity to underground development. This drill spacing is appropriate for defining the continuity and volume of the mineralised domains and estimating robust global Mineral Resources.
The portions of the MRE classified as Inferred typically represent peripheral areas of the deposit where geological continuity is present but not consistently confirmed by 15 m x 15 m drilling or closer.
A final reportable classification is generated post creation of a Stope Optimiser (SO) outcome used for RPEEE. Each SO is assigned a classification based on majority reporting by tonnes of the raw classification scheme.
The Mineral Resource classification appropriately reflects the view of the Competent Person.
|
| Audits or reviews |
The geological interpretation, estimation parameters and validation of the resource model was peer reviewed by Catalyst staff.
No external reviews of the resource estimate had been carried out at the time of writing.
|
| Discussion of relative accuracy/ confidence |
The relative accuracy of the Mineral Resource estimate is reflected in the reporting of the Mineral Resource as per the guidelines of the 2012 JORC Code.
The statement relates to the global estimates of tonnes and grade.
The estimation method adopted for the June 2024 MRE is believed to be appropriate for dealing with the high-degree of grade variability at Plutonic East.
The estimated uncertainty for an Indicated Mineral Resource is typically +/- 20% over an annual production period.
In most cases it is considered that only development/face sampling in conjunction with <10m x 10m drill spacing is sufficient to attain enough confidence for stoping.
|
Section 4 Estimation and Reporting of Ore Reserves
Plutonic East Deposit
(Criteria listed in section 1, and where relevant in sections 2 and 3, also apply to this section.)
| Criteria |
Commentary |
| Mineral Resource estimate for conversion to Ore Reserves |
The Mineral Resource Estimate (MRE) is defined as the August 2024 release (ASX Release - 'Plutonic East and K2 MineralResource Update 6th August 2024). Plutonic East 2024 MRE Measured 0Mt's @ 0g/t for 0koz. Indicated 0.9Mt's @ 2.8g/t for 80koz. Inferred 1.3Mt's @ 2.4g/t for 102koz. The 2024 MRE was depleted of mined voids (stopes and development) up to end of June 2024. This d MRE formed the basis of the 2024 ORE. The ORE is subset of the Measured and Indicated MRE and is spatially contained within the MRE. |
| Site visits |
The Competent person is a full-time employee of Catalyst Metals who has visited the Plutonic Mine site on a regular basis for the past 9 months. The competent person has 23+ years in Western Australian underground mining and mine planning practises with detailed knowledge of mining methods, current industry costs, schedule constraints and other material parameters relating to compiling an Ore Reserve Estimate. |
| Study status |
The Ore Reserve has been determined based on the current operational practises of the neighbouring Plutonic underground mine as well as reflecting the historical mining methods used in Plutonic East underground. The assessment is considered to be at a Pre-Feasibility level, using both internally and using external consultants with appropriate geotechnical, hydrological, equipment, metallurgical and mining method information. Environmental, social and other factors have been considered internally. Plutonic East underground operated from 2001 until 2012 with production of 812kt's @ 5.3g/t for 137.3koz. The Ore Reserves were estimated using Deswik software and reported against the 2024 MRE block model. Stope optimiser shapes were created (using minimum mining widths and heights – see "Mining factors or assumptions" for details), with additional modifying factors applied within the scheduling phase to accommodate planned and unplanned dilution / ore loss factors. Stope shapes and development ore were then assessed (post applying all forms of modifying factors) for economic viability using an operating cut-off grade value (COG). Additionally, the entire ORE was economically assessed over the scheduled life to accommodate capital and time dependent cost factors. Previous operational performance has demonstrated that the current mining methods are technically achievable and are economically viable. The modifying factors used in the Ore Reserves calculations are based on historically achieved mining dilution and recovery factors. |
| Cut-off parameters |
Stope optimiser shapes were initially categorised by using the operating cut-off grade (1.5g/t). Subsequently, stope shapes that were spatially distant from the mine's footprint were deleted to filter inventory requiring excessive development costs to access. The operating cut-off grade applied to the Ore Reserve Estimate was:
1.5g/t for stope shapes (after all forms of dilution and ore loss)
1.0g/t for ore development shapes (after applying development profiles to the ore boundary)
Cost and modifying factors used to determine the above COG's were:
Direct underground operating (mining and geology) A$ 59.0/ore t
Processing A$ 27.4/ore t
Site G&A A$16.7/ore t
Corporate Overhead A$2.6/ore t
Surface Haulage A$2.2/ore t
Metallurgical Recovery 84.0%
Royalties WA State 2.5% NSR
A gold price of A$2,700/oz was used in the assessment.
|
| Mining factors or assumptions |
The Ore Reserves estimate is reported within an underground Shape Optimiser (SO) evaluation from the 2024 MRE model. SO input parameters include a 1.5 g/t Au cut-off, minimum mining width 3m, minimum stope length of 5m, stope height of 5-25m and a gold price of A$$2,700/oz. The orientation of SO's is variable depending on the geometry of the mineralisation The Ore Reserves estimate is based on long-hole 'flat to sub vertical' bench stoping, the mining method previously applied at Plutonic East Underground. If a stope can be backfilled with waste rock, it will be filled. Plutonic East was in operation from 2001 to 2012 whereby flat to sub vertical bench stopes were extracted successfully along strike of the ore system. A small percentage of the stopes were waste loose backfilled to provide overlying access and/or passive hangingwall support. The historic voids have been incorporated into the MRE, with an additional 2.5m depletion skin around the stope voids incorporated into the MRE. Unclassified and Inferred material have not been included within the Ore Reserve Estimate, however if the material is mined as a consequence to mining an Ore Reserve estimated stope, then material had a zero-grade assigned and was therefore treated as waste. Dilution was designed within the SO evaluation, with a 0.5m hangingwall and footwall skin included to account for all forms of mining dilution. An ore recovery percentage of 90% was applied to all stopes. Development had no dilution applied and 100% mining recovery assumed. To illustrate the effect modifying factors have on the ORE, the below grade bins have been calculated from the total stope ORE inventory of 419,047t @ 2.5g/t for 34.1koz mined: Stope tonnes 0.0-1.5 g/t – 148,000t Stope tonnes > 1.5 g/t – 272,000t On this basis, the level of dilution applied to, and within, the SO shapes is deemed appropriate to represent final / executable stope design shapes. Cost estimates are based on actual Plutonic Underground data and engineering parameters. |
| Metallurgical factors or assumptions |
The Plutonic Gold Mine has been in operation since 1990. The original process plant ("PP1") consisted of an open circuit jaw crusher, coarse ore stockpile, semi-autogenous grinding ("SAG") mill and ball mills, two leach tanks, and six carbon adsorption tanks. A three-stage hard rock crushing circuit was incorporated in 1994 which included a fine ore bin and an additional ball mill. A second process plant ("PP2") was added in 1996 utilising the original PP1 jaw crusher and coarse ore stockpile and adding SAG and ball mills, two additional leach tanks and six additional carbon adsorption tanks. A 16 MW gas power station was added in 1997 and upgraded with new sets in 2014 and 2020 respectively. PP1 was designed for the treatment of primary ore while PP2 was designed to process oxide ore. At the end of June 2004, oxide ore sources were exhausted and the crushing and milling components of PP2 were shutdown. However, the leach and carbon adsorption circuit of PP2 was run in parallel with the PP1 leach/adsorption circuit. In April 2008 the PP2 leach and carbon adsorption circuit was emptied, cleaned, and placed into care and maintenance as part of a strategy to reduce the site power load and power consumption due to power restrictions caused by the June 2008 gas supply crisis. The four tanks in the PP2 leach and carbon adsorption circuit that were re-commissioned in June 2010 were shut down in 2012. Plant performance for the past five years displays consistent performance, with recoveries ranging from 80% to 90%, and an average recovery in 2023-24 of 86.5%. Metallurgical recoveries used to generate the Mineral Reserves were based on site production data and detailed metallurgical testing to an appropriate standard. A metallurgical recovery of 84% was used in the financial model for Plutonic East. |
| Environmental |
Mining licences / permits are currently granted for Plutonic East ORE within the next 18-24 months. Amendments to these existing approvals will be required, with a majority of the baseline surveys, field test work and submissions in progress. Licences / permits include:
Department of Water and Environmental Regulation (DWER) Works Approvals. DWER licenses water abstraction and pollution discharge activities.
DEMIRS Mining Proposal and Mine Closure Plans (or historical Notice of Intent – NOI). The Department of Mines, Energy, Industry Regulation and Safety ("DEMIRS"). DEMIRS administers and regulates the activities of the mining industry under the provisions of the Mining Act.
Native Vegetation Clearing Permit ("NVCP") under Part V of the EP Act and the Environmental Protection (Clearing of Native Vegetation) Regulations 2004.
Ground Water Licence - The abstraction of groundwater for water supply and/or mine dewatering purposes requires licences to be issued by the DWER (Water Section) under section 5C of the Rights in Water and Irrigation Act 1914 (the "RIWI Act").
Activities undertaken onsite are required to be undertaken in accordance with the above environmental approvals. Monitoring programs are conducted to ensure that key approval and licence requirements are complied with. |
| Infrastructure |
The Plutonic Gold Mine is a well-established mine with services and infrastructure consistent with an isolated operating mine. The existing site infrastructure can support the current mine plan, as historically the site has successfully operated at production rates significantly higher than those envisaged. |
| Costs |
Capital costs are based on current costs at Plutonic Underground, recent quoted assets and / or a budget level cost model. Operating costs are derived from the operating Plutonic Underground using current costs and budget models. Allowances have been made for State royalties (2.5%) payable on net revenue. Surface transport cost based on contracted or quoted rates. Treatment costs reflect the operating Plutonic Processing Plant. Cost models use Australian Dollar. |
| Revenue factors |
The Ore Reserve Estimate is generated at $A2,700/oz. |
| Market assessment |
Gold metal is a freely and widely traded commodity with a transparent mechanism for setting prices and for sale of gold produced. Doré is sold direct to the Perth Mint at spot price or used to fill hedging obligations. Catalyst has not conducted any studies or analyses such as commodity price projections, product valuations, market entry strategies, or product specification requirements. |
| Economic |
The Plutonic operation is economically robust and generates positive cashflow using the afore mentioned costs, revenue factors and a discount rate of 7%. |
| Social |
Catalyst continues to engage with stakeholders of the operation – local community, native title owners, Shire members and pastoralists. Catalyst is committed to strong environmental and social performance. There are no identified threats that place the company's social licence to operate at risk. |
| Other |
No material risks or impacts are identified. |
| Classification |
The Ore Reserves classification reflects the Competent Person's view of the deposit. Only Probable reserves have been declared and are based on Indicated Resources following consideration of appropriate modifying factors. No Proven Ore Reserves were derived from Measured Resources. |
| Audits or reviews |
No reviews or audits have been conducted on the Ore Reserve Estimate. |
| Discussion of relative accuracy/ confidence |
Plutonic Gold Operations is an operating, owner operated site – with a current 1.2Mtpa underground mine and 1.8Mtpa process plant. Planning and assessment of Plutonic East ORE are aligned to this operating model. |
APPENDIX 3
K2 UNDERGROUND – JORC CODE, 2012 EDITION – TABLE 1
Section 1 Sampling Techniques and Data
K2 Underground Deposit
(Criteria in this section apply to all succeeding sections.)
| Criteria |
Commentary |
| Sampling techniques |
No new drilling has been completed by Catalyst since acquisition of the project in 2023.
Vango drilling:
RC drilling assays were from 1 m samples split on the cyclone for the ultramafics. 1 m splits are taken over entirety of each drill hole using a 1/8 riffle splitter.
Diamond drilling assays were from mostly half core and minor quarter core, NQ2 and HQ size core. This was considered to be sufficient material for a representative sample. Core samples were taken at 1 m intervals or at geological boundaries.
Drillholes were generally designed to intersect mineralisation orthogonal to strike and core was oriented. Cutting of core was along the orientation line, in order to be as close as possible to orthogonal to mineralised structures and representative.
Historical drilling:
Quality of historical sampling information is varied. Previous work has been dominated by Resolute, BMA, Homestake, Barrick Resources and Dampier Gold, all of which are considered to have used high quality methodology for the time.
RC samples were collected as 4 m composite spear samples. Mineralised zones were sampled at 1 m intervals using a 1/8 riffle splitter.
Core samples were taken at 1m intervals or at geological boundaries from NQ2 and HQ Core.
Where sampling methods have not been recorded, results are consistent with, and of a similar quality, to results where methodology is known, including Vango methodology i.e. the Industry Standard approach above.
|
| Drilling technique s |
Vango drilling:
Reverse Circulation drilling was conducted utilizing a 5.75 inch face sampling bit.
Diamond drilling was conducted utilising NQ2 core. Core was orientated by spear methodology.
Historical drilling:
NQ/NQ2 and HQ Diamond drill-core, minor BQ diamond drill-core from underground K2.
Face Sampling, Reverse Circulation (RC) hammer.
Minor Aircore, RAB, and Blasthole drilling in oxide zones of some open pit resource areas.
|
| Drill sample recovery |
RC drilling was bagged on 1 m intervals and an estimate of sample recovery has been made on the size of each sample.
Recovery in diamond drilling based on measured core was returned for each 3 m.
No assessment of RC chip sample recoveries was undertaken on historical data however a comprehensive historical review of sampling procedures was undertaken which indicates that standard procedures where enacted to ensure minimal sample loss. Where limited information on the recoveries has been recorded, they have been consistent with those noted by recent drilling.
|
| Logging |
Vango drilling:
Reverse Circulation holes were logged on 1 m intervals.
Magnetic Susceptibility (KT 10) was recorded.
Diamond holes were:
logged in detail based on geological boundaries.
logged on 1 m intervals for geotechnical data.
photographed prior to cutting and sampling.
Geotechnically logged including RQD, recovery and FF
sampled for Metallurgical
testwork from logged HQ diamond holes
Historical drilling:
Previous work included examining historical Geological logs (WAMEX) in both hard copy and digital files. Logging codes have varied, but careful reconstruction of the geological sections has shown good correlation with the broad lithological logging.
Historical procedures are generally similar to that used currently.
|
| Sub-sampling techniques and sample preparation |
Vango drilling:
RC Drilling was sampled on 1 m samples using a cone splitter within the cyclone.
Half and quarter Diamond Drill Core, on selected intervals of between 0.8-1.25 m length. Core sampling was done using a diamond saw.
RC Drilling sampled on 1 m samples using a cone splitter within the cyclone.
In less prospective lithologies these 1 m samples were composited using a scoop over 4 m intervals.
Standards submitted every 20 samples of similar tenor to those expected in the sampling.
Blanks were inserted every 20 samples.
Field duplicate sampling was completed by passing the bulk reject sample from the plastic bag through a riffle splitter. In addition, 1⁄4 core was routinely submitted. Duplicate sample intervals were designated by the geologist.
Historical Drilling:
RC – 1 m samples collected at the rig using a 1:8 riffle splitter. Each sample was riffle split each 1 m sample to collect approximately 2 kg samples in calico bags, with the remaining sample retained on site in plastic bags. Four metre composite samples were also collected with any samples assaying greater than 0.1 g/t Au being re-split to 1 m intervals.
Core sampled was halved using a diamond saw and sampled at 1 m intervals, or to geological contacts.
Field duplicate sampling was completed by passing the bulk reject sample from the plastic bag through a riffle splitter. In addition, 1⁄4 core was routinely submitted. Duplicate sample intervals were designated by the geologist.
Sampling procedures for the Resolute drilling were not available.
|
| Quality of assay data and laboratory tests |
Vango drilling:
All samples were dried, crushed and pulverised then a 50g charge analysed at Intertek Laboratories using an Industry Standard Fire Assay method.
Standards submitted every 20 samples of grade-range/tenor similar to those expected in the sampling.
Blanks were inserted every 20 samples also.
Field duplicates also analysed.
Standards and Blanks were reported within acceptable accuracy and precision levels around the expected standard value
The results indicate the fire assay results from Intertek are of sufficient quality to be acceptable for use in resource estimation.
Historical Drilling:
Gold was analysed using fire assay with a 25-50g charge for Au within mineralised zones. Some Aqua regia data is included in the resources, generally in lower grade, oxide and transition, areas
Drilling programs carried out by HGAL have included ongoing QAQC procedures. These included the use of certified standards, blanks, check assay and duplicate sampling.
The various programs of QAQC carried out by HGAL have all produced results which support the sampling and assaying procedures used at the site.
Specific QAQC procedures for previous owners were unavailable.
|
| Verification of sampling and assaying |
Catalyst houses all drilling data in AcQuire software, the database was exported to MS Access and audited before resource estimation. Data is visually checked in 3D software before estimation takes place.
Vango drilling:
Data was provided from the field as paper logs for geology, DGPS files for locations, and CSV files from the laboratory for assays, validated and stored in the Terra Search Explorer3 RDBMS system.
Historical drilling data has undergone extensive validation including cross referencing to Annual reporting and internal data sources.
Analytical results from previous workers have been audited and, where possible, verified with reference to historical reports. Vango infill drilling has largely confirmed the thickness and tenor of previous drilling.
Scissored/twinned (<10m) holes have confirmed mineralised zones at many prospects in the area
|
| Location of data points |
Catalyst houses all drilling data in AcQuire software, the database was exported to MS Access and audited before resource estimation. Data is visually checked in 3D software before estimation takes place. All collar co-ordinates and downhole surveys were checked against historical data. The RLs of the collar positions were checked against a current drone topography surface and underground voids DTMs. Adjustments were made to erroneous data before estimation.
Downhole surveys are visually inspected in 3D software for anomalous changes in drill trace, (i.e. does the drill hole apparently bend inordinately).
Vango drilling:
DGPS has been used to locate all drillholes.
REFLEX Gyro Tool used for downhole surveys on all holes
Historic drilling:
Previous downhole survey data collected by REFLEX gyro tool and historically with Eastman cameras with follow-up down-hole surveys carried out by Surtron using gyroscopic survey equipment.
Where single shot cameras were used some magnetic units have affected the azimuth readings and these have not been used. Many holes have been surveyed using Gyro tools.
|
| Data spacing and distribution |
Drill spacing of approximately 20 m (along strike) by 20 m (on section) was considered adequate to establish both geological and grade continuity.
Closer spaced RC grade control drilling 5x5m is located in the pit areas
Broader spaced drilling up to 80 x 80 m has also been modelled but with lower confidence. Some sections have closer spacing in high grade zones confirming the continuity and structural understanding.
|
| Orientation of data in relation to geological structure |
The orientation of a majority of the drilling is approximately perpendicular to the strike and dip of the mineralisation and is unlikely to have introduced any sampling bias.
Certain holes have drilled parallel to key structures, but density of drilling and drilling on other orientations has allowed detailed geological modelling of these structures and hence any sampling bias in a single hole has been removed.
|
| Sample security |
Samples were bagged and labelled by company geologists or geological assistants and sealed in bulk bags with a security seal that remains unbroken when delivered to the lab.
No specific information has been obtained relating to historical sampling security.
|
| Audits or reviews |
Historical reviews of standards, blanks and duplicates indicate sampling and analysis has been completed with no issues discovered.
Historical reviews of the database for the
Marymia area have been examined previously and a proportion of holes were compared to original data sources and found to be consistent wherever checked.
|
Section 2 Reporting of Exploration Results
K2 Deposit
(Criteria listed in the preceding section also apply to this section.)
| Criteria |
Commentary |
| Mineral tenement and land tenure status |
Located in the Marymia - Plutonic Greenstone Belt ~218 km northeast of Meekatharra in the Midwest mining district in WA
K2 is located on the M52/183 granted tenement and is in good standing.
The tenements predate Native title interests but is covered by the Gingirana Native Title claim.
The tenements are 100% owned by Vango Mining Limited and subsidiary Dampier (Plutonic) Pty Ltd, who are being acquired by Catalyst Metals Ltd.
Gold production will be subject to a 2.5% government royalty.
|
| Exploration done by other parties |
Extensive previous work by Resolute Mining, Homestake Gold, Battle Mountain Australia, Barrick Mining and Dampier Gold.
Previous metallurgical and resource work has been completed by Resolute Mining, Barrick Mining and Dampier Gold.
|
| Geology |
The K2 deposit is located at the north-eastern end of the Plutonic Well Greenstone Belt, which forms part of the Marymia Inlier. The Marymia Inlier is a granite-greenstone terrane situated between the Yilgarn and Pilbara Cratons in Western Australia. The Plutonic Well Greenstone Belt is a north-easterly trending belt approximately 50km long and 10km wide. It consists of predominantly mid to upper greenschist facies metamorphosed ultramafic volcanics, tholeiitic basalts, minor felsic volcanics and sediments. The local Geology of K2 is composed of a series of north-east, south-west trending mafics, ultramafics and metasedimentary lithologies metamorphosed to lower amphibolite facies.
Marymia mineralisation is structurally controlled, orogenic, mesothermal (amphibolite metamorphic facies) in style, associated with the late tectonic D3 high-angle thrusting event and open folding/flexing and dilation of earlier - including D1/D2 thrusts.
Gold Mineralisation within the K2 pit showed a strong association with lithological contacts and high grade zones at the contact between a high Fe and high-Mg amphibolite unit.
|
| Drill hole Information |
Vango Work:
Location of drillholes based on historical reports and data, originally located on surveyed sites, and DGPS.
Northing and easting data generally within 0.1 m accuracy
RL data +-0.2 m
Down hole length =+- 0.1 m
Historical Work:
The majority of drill holes used in the resource estimate have been accurately surveyed by qualified surveyors using DGPS. Down hole surveys have been conducted at regular intervals using industry- standard equipment.
Where single shot cameras were used some magnetic units have affected the azimuth readings and these have not been used. Many holes have been surveyed using Gyro tools.
All Diamond and Reverse Circulation (RC) holes have been included.
Air Core and RAB drilling have been excluded from the resource calculations.
|
| Data aggregation methods |
No exploration has been reported in this release, therefore there are no drill hole intercepts to report. This section is not relevant to this report on Mineral Resource and ore Reserves.
|
| Relationship between mineralisation widths and intercept lengths |
No exploration has been reported in this release, therefore there are no drill hole intercepts to report. This section is not relevant to this report on Mineral Resource and ore Reserves.
|
| Diagrams |
No exploration has been reported in this release, therefore there are no drill hole intercepts to report. This section is not relevant to this report on Mineral Resource and ore Reserves.
|
| Balanced reporting |
No exploration has been reported in this release, therefore there are no drill hole intercepts to report. This section is not relevant to this report on Mineral Resource and ore Reserves.
|
| Other substantive exploration data |
No exploration has been reported in this release, therefore there are no drill hole intercepts to report. This section is not relevant to this report on Mineral Resource and ore Reserves.
|
| Further work |
Further drilling is planned at K2.
|
Section 3 Estimation and Reporting of Mineral Resources
K2 Underground Deposit
(Criteria listed in section 1, and where relevant in section 2, also apply to this section.)
| Criteria |
Commentary |
| Database integrity |
Catalyst houses all drilling data in AcQuire software, the database was exported to MS Access and audited before resource estimation. Data is visually checked in 3D software before estimation takes place.
Various validation checks in GEOVIA SurpacTM and Seequent Leapfrog GeoTM 3D software and data queries in MS Access were undertaken such as overlapping samples, duplicate entries, missing data, sample length exceeding hole length, unusual assay values and a review of below detection limit samples. A visual examination of the data was also completed to check for erroneous downhole surveys and co-ordinates. All drillhole traces were checked against historical data.
The data validation process identified no major drill hole data issues that would materially affect the MRE outcomes.
Database checks included the following:
Checking for duplicate drill hole names and duplicate coordinates in the collar table.
Checking for missing drill holes in the collar, survey, assay and geology tables based on drill hole names.
Checking for survey inconsistencies including dips and azimuths <0 ̊, dips >90 ̊, azimuths >360 ̊ and negative depth values.
The
drillhole database to May 2, 2024, comprised 22,991 Collar records, 55,757 Survey records, and 242,074 Assay records. The compiled database used for resource estimation comprised 22,961 Collar records, 56,668 Survey records, and 243,715 Assay records.
|
| Site visits |
The Competent Person undertakes frequent site visits to the Plutonic Gold Operation and associated Marymia tenements.
|
| Geological interpretation |
Regionally, the Plutonic Gold Belt lies in the Archaean Plutonic Well Greenstone Belt, an elongate NE trending belt within the Marymia Inlier. The Marymia Inlier is an Archaean basement remnant within the Proterozoic Capricorn Orogen and comprises two mineralised greenstone belts (Plutonic Well and Baumgarten greenstone belts), with surrounding granite and gneissic complexes.
The Marymia Greenstone Belt comprises two corridors of northeast – southwest trending mafic/ultramafic and sedimentary sequences separated by a conglomerate-dominated sedimentary sequence.
The K2 deposit lies along the northern flank of the Plutonic Well Greenstone Belt within the mining lease M52/183. The geology of the K2 area is dominated by north east- south west trending mafic-ultramafic and sedimentary package which has been metamorphosed to lower amphibolite facies and intensely deformed. Foliation and bedding are generally steeply dipping.
A total of 146492.7 m of drilling from 120 diamond and diamond tails, 1,297 RC holes, 754 Rotary Air blast (RAB) holes, 12 Air Core (AC) and 3 holes of an unknown type were available for interpretation of the MRE and supported by a nominal drill density of 20 x 20m.
Gold mineralisation at K2 demonstrates a close association with lithological contacts, in particular the sheared contact between high iron and high magnesian amphibolite units.
A cut-off grade of 0.2 g/t Au was used to guide the geological continuity of the interpreted mineralisation lodes.
Catalyst considers confidence is moderate to high in the geological interpretation and continuity of the mineralisation domains.
|
| Dimensions |
K2 mineralised domains extend approximately 1,200 m along strike (9 domains total) and to 400m below surface (250mRL).
The domains strike north east-south west and are sub-vertical with an average thickness of 2 to 4 m. Mineralisation has been delineated at a nominal 0.2g/t cut-off.
|
| Estimation and modelling techniques |
All geological domains used in the MRE were constructed in Leapfrog software. Block modelling and grade interpolation were carried out using Surpac software. Statistical analysis was carried out using Supervisor software.
Block model constraints were created by applying the interpreted mineralised domain wireframes. Sub-celling in all domains was 1.25 m x 1.25 m x 1.25 m to accurately reflect the volumes of the interpreted wireframes.
All drillhole assay samples were uniquely flagged according to the mineralisation domains. All drillholes are composited to 1m downhole using a best-fit methodology and 0.5 m minimum threshold on inclusions. All RC and DD samples were composited to 1m downhole using a best-fit methodology and 0.5 m minimum threshold on inclusions. A small of residual composites were retained in the estimation.
K2 mineralisation is hosted in multiple sub-parallel and sub-vertical tabular lenses ranging in strike length from 150m up to nearly 1,200m in length. The vertical extent of individual lenses can range from around 100m to 400m vertically. The true width of the lenses ranges from 1m to >10m. The K2 July 2024 MRE incorporates the estimation of nine individual mineralised lenses comprising:
K2 – Domains 1001-1005 K2 South East – Domains 2001-2004
The distribution of gold grades within the mineralised lenses is highly variable and is characterised by distinct cohesive regions of higher tenor gold grades, with clusters of individual values often reaching over thirty grams per tonne. Whilst these higher-grade zones appear reasonably cohesive, they are manifested by a high-degree of short-scale variability, making difficult to manually interpret constraining domains. These internal; high-grade regions are often surrounded by peripheral regions of lower grade mineralisation that is also highly variable.
Raw Coefficients of Variation (CoV) are typically in the order of 2 to 14, indicating moderate to high grade variability.
The moderate to high grade variability and complex spatial continuity of high grades at K2 requires a pseudo non-linear approach to deal with these high grades during estimation. A traditional approach of physical domaining, assay cutting, and linear estimation (IDW or OK) is considered inadequate in dealing with this complexity.
The estimation method applied to most of the domains combines Categorical Indicator Kriging (CIK) to define internal estimation sub-domains domains, together with applying distance limiting at chosen grade thresholds to restrict the influence of the high grade and extreme grade values during grade interpolation.
Prior to estimation, a reference surface for each estimation domain was exported from the Leapfrog. This is calculated as the best fit surface using the hangingwall and footwall surfaces. The reference surface is then imported into Surpac and a dip and dip-direction of each triangle facets is imported into the Surpac block model to provide information for dynamic search and variogram model orientation during interpolation. Dynamic estimation is applied for estimating the CIK indicators and gold grades.
Categorical Indicator Kriging Workflow
Two Categorical Indicator values are determined for the CIK domains:
A low-grade (LG) indicator of 0.2 g/t Au was assigned to differentiate between background 'waste' and low-tenor mineralisation.
A high-grade (HG) indicator of 1.4 g/t Au was assigned to define broad areas of consistent higher-tenor mineralisation.
Indicator variograms were modelled for the LG and HG thresholds for all mine areas. The indicator variograms for both grade thresholds exhibited a moderate nugget effect of around 30%. The LG indicator demonstrated well-structured average continuity of up to 80m. The HG indicator demonstrated less well-structured average continuity of around 20m.
The CIK indicators were estimated using Ordinary Kriging into a finely gridded block model with block dimensions of 1.25m x 1.25m x 1.25m. The small block size for the indicator process is beneficial for creating categorical sub-domains at resolution which can be used to accurately back-flag composite data.
Three categorical sub-domains were generated: low-grade (LG), medium-grade (MG) and high-grade (HG) areas. The HG sub-domain was based on an indicator probability threshold of 0.35 and the LG sub-domain was based on an indicator probability threshold of 0.65. The MG sub-domain is assigned to blocks that do not satisfy either the HG or LG sub-domain criteria.
The three categorical block model sub-domains (HG, MG and LG) were used to 'back-flag' the 1m composites from each mine area, thus creating a separate composite file for each sub-domain.
Assay top-cuts are applied to the sub-domain composite files on a domain-by-domain basis and typically in the following ranges:
HG = 15-75 g/t Au
MG = 5-10 g/t Au
LG = 0.5-3 g/t Au
The assay top-cuts were generally between the 97th to 99.9th percentile of the distribution and were aimed at globally limiting extreme values only. Top-cuts are not used as the primary tool to control metal risk. The use of grade thresholds and distance limiting is considered a more objective and influential method in controlling metal risk, while better reflecting the actual localised occurrence of discontinuous high-grade gold mineralisation.
Grade variograms were initially attempted separately for the LG, MG and HG sub-domains, however, this resulted in poorly structured and incoherent variograms. It was decided to use a variogram modelled on the combined grade data set. The combined grade variogram exhibited a moderate nugget effect of 35% with a maximum range of continuity of 45m.
Grade thresholds for distance limiting were initially determined for each mine area from log-probability plots and visual inspection. Final distance limits were subsequently optimised following a detailed backward-looking mill reconciliation using historic open pit mining during the period July 1992 to December 1995 (964Kt). The adjustment of grade distance limits was an iterative process until an acceptable reconciliation with the mill was achieved. The final applied grade distance limits are follows:
0-10 g/t = No Limit 10-30 g/t = 20m >30 g/t = 12.5m
Prior to grade estimation, sub-domain codes from the 1.25m resolution block model are imported into a 2.5m x 2.5m x 2.5m resolution model and the proportion of LG, MG and HG is calculated for each 2.5m block. Grade estimation for the LG, MG and HG domains was undertaken in Surpac software using Ordinary Kriging with grade threshold distance limiting. Kriging Neighbourhood Analysis (KNA) was undertaken to assist with defining estimation parameters. Search routines and variogram orientations are drawn from the pre-populated dynamic search information recorded in each block.
Final block grades at a 2.5m x 2.5m x 2.5m block resolution were calculated by weighting the estimated grades for each sub-domain by the relevant domain proportion. The parent estimation block size was 2.5m x 2.5m x 2.5m. A minimum of 2 and maximum of 12 composites were used for each sub-domain estimate per block. It is possible that up to 36 composites can be used to estimate a parent block where there is a proportion of all three sib-domains present. Block discretisation was set at 3 E x 3 N x 3 RL points (per parent block). A standardised single pass search distance of 45m was used. Octant restrictions were not used. Data spacing varied from <10m x 10m to >40m x 40m.
Model validation was completed to check that the grade estimates within the model were an appropriate reflection of the underlying composite sample data, and to confirm that the interpolation parameters were applied as intended. Checks of the estimated block grade with the corresponding composite dataset were completed using several approaches involving both numerical and spatial aspects as follows:
Semi-Local: Using swath plots in X, Y and Z directions comparing the estimates to the sample data.
Local: Visual inspection of the estimated block grades viewed in conjunction with the sample data.
|
| Moisture |
All estimations were carried out using a 'dry' basis.
|
| Cut-off parameters |
K2 underground Mineral Resources are reported at a cut-off grade of 1.5 g/t Au. The cut-off grade has been derived from current mining and processing costs and metallurgical parameters.
|
| Mining factors or assumptions |
The K2 underground Mineral Resource estimate is reported within an underground Shape Optimiser (SO) evaluation from the undiluted and depleted resource model. SO input parameters include a 1.5 g/t Au cut-off, minimum mining width of 1.5m, minimum stope length of 5m, minimum stope height of 5m and a gold price of AUD$3,200/oz.
The orientation of SO's is variable depending on the geometry of the mineralisation.
|
| Metallurgical factors or assumptions |
It is assumed the material will be trucked and processed at the Plutonic Gold Plant. Recovery factors are assigned based on lab test work.
No metallurgical assumptions have been built or applied to the resource model.
|
| Environmental factors or assumptions |
A conventional storage facility is used for the process plant tailings.
The small amount of waste rock is stored in a traditional waste rock landform 'waste dump'. Due to low sulphide content and the presence of carbonate alteration the potential for acid content is considered low.
|
| Bulk density |
Density has been assigned to the resource models using interpreted weathering surfaces determined from drill hole logging.
Oxide =1.8
Transitional=2.2
Fresh=2.9
|
| Classification |
Factors considered when classifying the model include:
The portions of the K2 MRE classified as Indicated have been flagged in areas of the model where average drill hole spacing is typically 20m x 20m or closer. The drill spacing within the Indicated portion of the resource is appropriate for defining the continuity and volume of the mineralised domains, at a nominal 20 m drill spacing on 20 m sections.
The portions of the MRE classified as Inferred typically represent minor lodes or portions of larger domains where geological continuity is present but not consistently confirmed by 20 m x 20 m drilling.
Further considerations of resource classification include; data type and quality (drilling type, drilling orientations, down hole surveys, sampling and assaying methods); geological confidence and geostatistical considerations.
A final reportable classification is generated post creation of a Stope Optimiser (SO) outcome used for RPEEE. Each SO is assigned a classification based on majority reporting by tonnes of the raw classification scheme.
The Mineral Resource estimate appropriately reflects the view of the Competent Person.
|
| Audits or reviews |
The geological interpretation, estimation parameters and validation of the resource model was peer reviewed by Catalyst staff.
No external reviews of the resource estimate had been carried out at the time of writing.
|
| Discussion of relative accuracy/ confidence |
The relative accuracy of the Mineral Resource estimate is reflected in the reporting of the Mineral Resource as per the guidelines of the 2012 JORC Code.
The statement relates to the global estimates of tonnes and grade.
|
Section 4 Estimation and Reporting of Ore Reserves
K2 Underground Deposit
(Criteria listed in section 1, and where relevant in sections 2 and 3, also apply to this section.)
| Criteria |
Commentary |
| Mineral Resource estimate for conversion to Ore Reserves |
The Mineral Resource Estimate (MRE) is defined as the August 2024 release (ASX Release - 'Plutonic East and K2 Mineral Resource Update 6th August 2024). K2 2024 MRE
Measured 0Mt's @ 0g/t for 0koz.
Indicated 0.2Mt's @ 4.2g/t for 31koz.
Inferred 0.5Mt's @ 3.4g/t for 49koz.
The 2024 MRE was depleted of mined voids (stopes and development) up to end of June 2024. This depleted MRE formed the basis of the 2024 ORE. The ORE is subset of the Measured and Indicated MRE and is spatially contained within the MRE. |
| Site visits |
The Competent person is a full-time employee of Catalyst Metals who has visited the Plutonic Mine site on a regular basis for the past 9 months. The competent person has 23+ years in Western Australian underground mining and mine planning practises with detailed knowledge of mining methods, current industry costs, schedule constraints and other material parameters relating to compiling an Ore Reserve Estimate. |
| Study status |
The Ore Reserve has been determined based on the current operational practises of the neighbouring Plutonic underground mine as well as reflecting the historical mining methods proposed for K2. The assessment is considered to be at Pre-Feasibility level, using both internally and using external consultants with appropriate geotechnical, hydrological, equipment, metallurgical and mining method information. Environmental, social and other factors have been considered internally. K2 underground operated from 1997 to 1998, with only the portal and decline developed. The Marymia Operation (including the K2 underground) was placed under Care and Maintenance in mid-1998 because of a depressed gold price environment.
The overlying open pit was mined in 1992 to 1995 with a production of 966kt's @ 4.0g/t for 116koz. The Ore Reserves were estimated using Deswik software and reported against the 2024 MRE block model. Stope optimiser shapes were created (using minimum mining widths and heights – see "Mining factors or assumptions" for details), with additional modifying factors applied within the scheduling phase to accommodate planned and unplanned dilution / ore loss factors. Stope shapes and development ore were then assessed (post applying all forms of modifying factors) for economic viability using an operating cut-off grade value (COG). Additionally, the entire ORE was economically assessed over the scheduled life to accommodate capital and time dependent cost factors. Previous technical studies and assessments have demonstrated that the proposed mining methods are technically achievable and are economically viable. |
| Cut-off parameters |
Stope optimiser shapes were initially categorised by using the operating cut-off grade (1.7g/t). Subsequently, stope shapes that were spatially distant from the mine's footprint were deleted to filter inventory requiring excessive development costs to access. The operating cut-off grade applied to the Ore Reserve Estimate was:
1.7g/t for stope shapes (after all forms of dilution and ore loss)
1.1g/t for ore development shapes (after applying development profiles to the ore boundary)
Cost and modifying factors used to determine the above COG's were:
Direct underground operating (mining and geology) A$ 70.80/ore t
Processing A$ 27.4/ore t
Site G&A A$16.7/ore t
Corporate Overhead A$2.6/ore t
Surface Haulage A$12.0/ore t
Metallurgical Recovery 91.0%
Royalties WA State 2.5% NSR
A gold price of A$2,700/oz was used in the assessment.
|
| Mining factors or assumptions |
The Ore Reserves estimate is reported within an underground Shape Optimiser (SO) evaluation from the 2024 MRE model.
SO input parameters include a 1.7 g/t Au cut-off, minimum mining width 2.75m, minimum stope length of 8m, stope height of 17m and a gold price of A$$2,700/oz. The orientation of SO's is variable depending on the geometry of the mineralisation The Ore Reserves estimate is based on narrow long-hole open stoping, the mining method previously proposed for K2 underground. If a stope can be backfilled with waste rock, it will be filled. K2 was in operation from 1997-1998 whereby narrow upohole stopes were planned to be extracted along strike of the ore system. The historic voids have been incorporated into the MRE. Unclassified and Inferred material have not been included within the Ore Reserve Estimate, however if the material is mined consequently to mining an Ore Reserve estimated stope, then material had a zero-grade assigned and was therefore treated as waste. Dilution was designed within the SO evaluation, with a 0.5m hangingwall and 0.25m footwall skin included, to account for all forms of mining dilution. An ore recovery percentage of 95% was applied to all stopes. Development had no dilution applied and 100% mining recovery assumed. To illustrate the effect modifying factors have on the ORE, the below grade bins have been calculated from the total stope ORE inventory of 134,620,706t @ 4.4g/t for 19.1koz mined:
Stope tonnes 0.0-0.9 g/t – 26,000t
Stope tonnes 0.9-0.1.5 g/t – 5,000t
Stope tonnes > 1.5 g/t – 104,000t
On this basis, the level of dilution applied to, and within,
the SO shapes is deemed appropriate to represent final / executable stope design shapes. Cost estimates are based on actual Plutonic Underground data and engineering parameters. |
| Metallurgical factors or assumptions |
The Plutonic Gold Mine has been in operation since 1990. The original process plant ("PP1") consisted of an open circuit jaw crusher, coarse ore stockpile, semi-autogenous grinding ("SAG") mill and ball mills, two leach tanks, and six carbon adsorption tanks. A three-stage hard rock crushing circuit was incorporated in 1994 which included a fine ore bin and an additional ball mill. A second process plant ("PP2") was added in 1996 utilising the original PP1 jaw crusher and coarse ore stockpile and adding SAG and ball mills, two additional leach tanks and six additional carbon adsorption tanks. A 16 MW gas power station was added in 1997 and upgraded with new sets in 2014 and 2020 respectively. PP1 was designed for the treatment of primary ore while PP2 was designed to process oxide ore. At the end of June 2004, oxide ore sources were exhausted and the crushing and milling components of PP2 were shutdown. However, the leach and carbon adsorption circuit of PP2 was run in parallel with the PP1 leach/adsorption circuit. In April 2008 the PP2 leach and carbon adsorption circuit was emptied, cleaned, and placed into care and maintenance as part of a strategy to reduce the site power load and power consumption due to power restrictions caused by the June 2008 gas supply crisis. The four tanks in the PP2 leach and carbon adsorption circuit that were re-commissioned in June 2010 were shut down in 2012. Plant performance for the past five years displays consistent performance, with recoveries ranging from 80% to 90%, and an average recovery in 2023-24 of 86.5%. Metallurgical recoveries used to generate the Mineral Reserves were based on site production data and detailed metallurgical testing to an appropriate standard. K2 was historically processed at the decommissioned Marymia Process Plant. Historical records and recent test works have indicated a 91% average recovery. |
| Environmental |
Mining licences / permits are currently granted for K2 ORE mining within the initial 6-12 months. Amendments to these existing approvals will be required, with a majority of the baseline surveys, field test work and submissions in progress. Licences / permits include:
Department of Water and Environmental Regulation (DWER) Works Approvals. DWER licenses water abstraction and pollution discharge activities.
DEMIRS Mining Proposal and Mine Closure Plans (or historical Notice of Intent – NOI). The Department of Mines, Energy, Industry Regulation and Safety ("DEMIRS"). DEMIRS administers and regulates the activities of the mining industry under the provisions of the Mining Act.
Native Vegetation Clearing Permit ("NVCP") under Part V of the EP Act and the Environmental Protection (Clearing of Native Vegetation) Regulations 2004.
Ground Water Licence - The abstraction of groundwater for water supply and/or mine dewatering purposes requires licences to be issued by the DWER (Water Section) under section 5C of the Rights in Water and Irrigation Act 1914 (the "RIWI Act").
Activities undertaken onsite are required to be undertaken in accordance with the above environmental approvals. Monitoring programs are conducted to ensure that key approval and licence requirements are complied with. |
| Infrastructure |
The Plutonic Gold Mine is a well-established mine with services and infrastructure consistent with an isolated operating mine. The existing site infrastructure can support the current mine plan, as historically the site has successfully operated at production rates significantly higher than those envisaged. |
| Costs |
Capital costs are based on current costs at Plutonic Underground, recent quoted assets and / or a budget level cost model. Operating costs are derived from the operating Plutonic Underground using current costs and budget models. Allowances have been made for State royalties (2.5%) payable on net revenue. Surface transport cost based on contracted or quoted rates. Treatment costs reflect the operating Plutonic Processing Plant. Royalty costs are included. Cost models use Australian Dollar |
| Revenue factors |
The Ore Reserve Estimate is generated at $A2,700/oz. |
| Market assessment |
Gold metal is a freely and widely traded commodity with a transparent mechanism for setting prices and for sale of gold produced. Doré is sold direct to the Perth Mint at spot price or used to fill hedging obligations. Catalyst has not conducted any studies or analyses such as commodity price projections, product valuations, market entry strategies, or product specification requirements. |
| Economic |
The K2 operation is economically robust and generates positive cashflow using the afore mentioned costs, revenue factors and a discount rate of 7%. |
| Social |
Catalyst continues to engage with stakeholders of the operation – local community, native title owners, Shire members and pastoralists. Catalyst is committed to strong environmental and social performance. There are no identified threats that place the company's social licence to operate at risk. |
| Other |
No material risks or impacts are identified. |
| Classification |
The Ore Reserves classification reflects the Competent Person's view of the deposit. Only Probable reserves have been declared and are based on Indicated Resources following consideration of appropriate modifying factors. No Proven Ore Reserves were derived from Measured Resources. |
| Audits or reviews |
No reviews or audits have been conducted on the Ore Reserve Estimate. |
| Discussion of relative accuracy/ confidence |
Plutonic Gold Operations is an operating, owner operated site – with a current 1.2Mtpa underground mine and 1.8Mtpa process plant. Planning and assessment of K2 ORE are aligned to this operating model. |
APPENDIX 4
HENTY UNDERGROUND – JORC CODE, 2012 EDITION – TABLE 1
Section 1 Sampling Techniques and Data
Henty Gold Mine Deposit
(Criteria in this section apply to all succeeding sections.)
| Criteria |
Commentary |
| Sampling techniques |
The sampling database for Henty includes data using diamond drilling (DD), channel sampling and sludge sampling techniques.
The database was compiled from information collected by numerous previous owners of the project including:
Catalyst Metals Ltd (CYL) (2021 to current)
Diversified Minerals (DVM) (2016 to 2020)
Unity Mining (2009 to 2016)
Barrick Gold (2006 to 2009)
Placer Dome (2003 to 2006)
Aurion Gold (2001 to 2003)
RGC/Goldfields (1996 to 2001).
Details relating to drilling techniques, quality assurance (QA) protocols and quality control (QC) results for data prior to 2009 is unavailable. Drilling completed since 2009 has reasonable, although partially incomplete descriptions of data collection procedures and relevant QAQC.
Diamond drillholes are sampled as either whole core or half core. Samples are taken at 0.2–1 m intervals and honour geological boundaries.
Face sampling is carried out at mineralisation height (~1.5 m). Samples are taken at 0.2–1 m intervals and honour geological boundaries and mineralised zones as defined by geologists.
Sludge holes are drilled with underground production rigs, with samples collected by operators for each drill rod from drill return fines, and holes flushed between samples.
Sludge hole collar positions are marked out by site surveyors and picked up once holes are completed, with hole dip and azimuth not measured and taken from design documents.
Sludge samples are processed at the
Burnie ALS laboratory using fire assay, with crushed rock standard and blank material is submitted with each sludge sample batch.
Diamond drilling and face samples were subsequently
pulverised to produce a 30 g charge for fire assay with determination by atomic absorption spectrometry (FA/AAS) for gold.
|
| Drilling techniques |
Underground mobile DD drill rigs are
utilised
to
produce
either LTK60 or NQ2 size core. Drill core is not routinely oriented.
|
| Drill sample recovery |
Drilling recoveries are recorded for diamond core samples as part of
geotechnical logging.
Recovery of drill core is
maximised
by
using
drilling
techniques and drilling fluids suited to the particular ground conditions.
No relationship between grade and recovery has been identified.
|
| Logging |
Drillhole logging is carried out at a core shed with adequate facilities including roller-racks, lighting, core photograph facilities and an automatic core saw.
Drillholes are logged directly into a MS Excel based spreadsheet on a lap top computer. A template with project-specific codes has been set up to ensure consistent collection of relevant geological information.
Alteration, geotechnical, structure and rock type information are collected into separate tables using standalone codes. Zones of core loss are also recorded.
Underground, the backs are mapped 6 m from the face to provide a check for the mapping from the previous round. If a round is missed, then 9 m requires mapping to provide the
3 m overlap for checking. Faces are photographed for future reference.
Logging is generally qualitative in nature. All core is stored at site and has been photographed wet.
All DD core has been geologically logged in full (100%)
|
| Sub-sampling techniques and sample preparation |
DD samples are generally half core, cut using an automatic core saw. In areas where infill drilling is required, whole core may be submitted given that there are other holes available with half core for future reference.
Face sampling is carried out at grade height (~1.5 m). A duplicate sample is taken on all faces to assist in monitoring sample precision and representivity. An effort is made to collect representative samples and reduce the potential for contamination.
Sludge holes are drilled with underground production rigs, with samples collected by operators for each drill rod from drill return fines, and holes flushed between samples.
Several laboratories and assay techniques have been used throughout the Project's history.
Samples are initially crushed to a size of 10 mm, with the jaw crusher cleaned by compressed air between samples.
Samples are riffle split down to 1 kg, with the remaining samples returned as coarse reject to site and stored under cover for future reference.
The 1 kg sample is pulverised using an LM5 pulveriser to a size of 85% passing 75 μm, and the mill cleaned with a barren silica flush between samples.
The fine 200 g material is taken via scoop, from which 30 g is taken for fire assay (FA50).
Subsampling is performed during the sample preparation stage according to the assay laboratories' internal protocols.
Field duplicates of diamond core, i.e. other than half of cut core, have not been routinely assayed.
Field duplicate samples are taken on all underground faces to assist in monitoring sample precision and representivity.
Sample sizes are considered appropriate for the material being sampled.
|
| Quality of assay data and laboratory tes |
All samples are currently submitted to ALS Burnie for gold analysis.
Between April and December 2022, samples were temporarily sent to Intertek laboratory in Adelaide.
Samples are crushed and pulverised prior to selection of a 30 g subsample for fire assay with determination by AAS. Previous owners have adopted similar methods.
Occasionally, bismuth, silver, copper, lead, zinc, arsenic and molybdenum analyses are completed to assist with understanding the nature of the mineralisation and for metallurgical assessment. Copper, for example, may consume cyanide during processing. If required, pulps are sent from Burnie to ALS Townsville for determination via inductively coupled plasma (ICP) analysis.
For drilling CYL specifies inclusion of field blanks at a rate of one blank every 30 samples submitted. The blanks are composed of barren basalt material, which is obtained from a commercial distributor in the town of Devonport on the north coast of Tasmania.
CYL specifies inclusion of standards at a rate of two for every 30 core samples submitted, and two standards for every batch of channel/sludge samples submitted. Commercially available CRMs covering ranges considered as representing low, moderate and high values for gold were obtained from OREAS.
Inclusion of field duplicates for core samples is not routinely carried out by CYL pulp duplicates insertion rates are not specified by CYL. Assay laboratory internal QA protocols are relied upon for analysis of pulp duplicates.
For Face Sampling CYL specifies that two standards and a blank are submitted with each batch to monitor analytical bias and cross-sample contamination respectively. The QC samples are suffixed A, B and C at the end of each submission sheet. Low, medium and high-grade CRMs are used.
CYL specify that a field duplicate interval is taken and submitted for analysis for each heading sampled, with final results averaged across the two samples submitted for each interval.
Pulp duplicates insertion rates are not specified by CYL. Assay laboratory internal QA protocols are relied upon for analysis of pulp duplicates.
Historical monthly
QC reports compiled between 2010 and 2022 were reviewed by CSA Global in 2023. They considered the results as suitable to support the data gathered.
CSA Global reviewed the CRMs and face sampling duplicates collected between January 2021 and December 2022. The eight certified reference materials (CRMs) performed well with a low bias observed in OREAS 611. Plot of the duplicate data shows some scatter and 29% of the data has a precision within 10% of the original sample.
QAQC information for data prior to 2009 is largely unavailable.
The Competent Person has reviewed all available data and considers that acceptable levels of precision and accuracy have been established for the current drilling dataset. There is a greater degree of uncertainty attached to the historical dataset.
No geophysical tools were used to support the preparation of this Mineral Resource estimate.
|
| Verification of sampling and assaying |
Currently drillhole logging is completed at the core shed on a lap top computer directly into a Microsoft Excel based spreadsheet which has been designed for the mine site.
Core is photographed wet at the core shed. Core photographs are stored on the server for future reference.
Face mapping and sampling data is entered in a face mapping sheet, along with the face number, distance to the nearest survey station, the width and the height of the face, over-break estimate, time and date, scale and name of geologist and classification of face (run-of-mine (ROM) or waste). Once the geologist returns to the office, the data is entered in a Microsoft Excel spreadsheet.
The location of the face is then determined in Datamine using the query line command. The face sample is treated as a short drillhole, with collar and survey information. The output of the query line command is entered in the Microsoft Excel spreadsheet which then updates the collar information.
Core logging and sampling data is saved in the same logging and sampling spreadsheet that is used for face sampling. The data is then manually exported to a specific directory. The exported files and Datashed database are then opened, and data from each sheet of the export document is then copied into the relevant Datashed table. Data is then exported from Datashed as CSV files ready for import into Datamine.
Analytical data is imported directly into the Datashed database from files sent by the laboratory.
No adjustments were made to the analytical data, other than replacing below detection results with a value equal to half the detection limit.
Historical sampling methods are not known.
No twinning has been completed.
|
| Location of data points |
Current diamond drillhole collar positions are set out by Mine Surveyors. The drilling crew has an azi-reader device that enables them to set up at the correct azimuth and dip according to the drillhole plan.
Final collar positions are picked up by Mine Surveyors at hole completion.
Downhole surveys are completed using a Devi-flex tool, with surveys taken every few metres.
Development drives are regularly picked up by Mine Surveyors.
At stope completion, a cavity monitoring system is generally used to model the final voids. Some historical stopes have not been picked up.
The grid system used is Geocentric Datum of Australia 1994 (GDA94).
A topographic file was not used in the preparation of this Mineral Resource estimate.
Historical methods are not known with any certainty; however, the Competent Person considers it is reasonable to assume that industry standard techniques have been adopted over the Project's history.
|
| Data spacing and distribution |
Areas that remain in situ are generally drilled at 10–20 m(E) x 10– 20 m(RL) spacings in the Mineral Resource area. The drill spacing varies between deposits, and lenses within a deposit. Areas towards the periphery of the lenses are often drilled at broader spacings.
The Competent Person believes the mineralised domains have sufficient geological and grade continuity to support the classifications applied to the Mineral Resources.
Mineral Resource estimation procedures are considered appropriate given the quantity of data available and style of mineralisation under consideration.
Compositing was not applied at the sampling stage.
|
| Orientation of data in relation to geological structure |
The drilling has been undertaken at various orientations, given the limited platforms available underground. Holes are mostly drilled at a high angle to the mineralisation with some drilled close to sub-parallel to the mineralisation.
Face sampling is carried out close to orthogonal to the mineralisation. The relationship between the drilling orientation and the orientation of key mineralised structures is not considered to have introduced a sampling bias.
|
| Sample security |
Core is transported to the core shed for processing, which is locked at the end of each day.
Core samples are placed in a polyweave sack for transportation to the laboratory.
Face samples are placed in an oven on site after the geologist returns from underground. The primary laboratory (ALS in Burnie) collects the samples each morning.
Historical methods are not known with any certainty; however, the Competent Person considers it is reasonable to assume that industry standard techniques have been adopted over the Project's history.
|
| Audits or reviews |
CSA
Global completed
a
review of
data
collection
techniques
in 2017.
|
Section 2 Reporting of Exploration Results
Henty Gold Mine Deposit
(Criteria listed in the preceding section also apply to this section.)
| Criteria |
Commentary |
| Mineral tenement and land tenure status |
Located in the Mount Read Volcanic Belt in western Tasmania, land tenure consists of three mining leases – 7M/1991, 5M/2002, and 7M/2006.
Two exploration licences adjoin the mining leases – EL8/2009 to the north and east, and EL28/2001 to the south.
EL28/2001 was granted on 19 June 2002 and expires on 10 May 2025. The tenure of 7M/1991, 5M/2002 and 7M/2006 expired on 1 June 2022, EL8/2009 expires on
15 November 2024 and EL28/2001 will expire on 10 May 2025.
The renewal applications for the 7M/1991, 5M/2002, 7M/2006 are pending approval.
The tenements are in good standing and no known impediments exist.
|
| Exploration done by other parties |
Other companies
to
have held
the
project
leases
include:
Diversified Minerals (2017 to 2021)
Unity Mining (2009 to 2016)
Barrick Gold (2006 to 2009)
Placer Dome (2003 to 2006)
Aurion Gold (2001 to 2003)
RGC/Goldfields (1996 to 2001).
|
| Geology |
The Henty deposit lies within the Mount Read Volcanic Belt in western Tasmania. The belt hosts several world-class polymetallic orebodies including the Hellyer, Que River, Rosebery, Hercules and Mount Lyell deposits. The whole belt has been overprinted with a regional lower green schist facies metamorphism.
Mineralisation consists of a series of small high-grade lenses of gold mineralisation hosted in quartz-sericite altered volcaniclastic and volcanic rocks that occupy a large sub-vertical quartz-sericite alteration shear zone. Gold is present as both free gold and as gold-rich electrum associated with chalcopyrite and galena in the main mineralised zone.
|
| Drill hole Information |
No exploration results are being reported as part of this
MRE update.
|
| Data aggregation methods |
No exploration results are being reported as part of this
MRE update.
|
| Relationship between mineralisation widths and intercept lengths |
No exploration results are being reported as part of this
MRE update.
|
| Diagrams |
No significant discovery is being reported. Plan and long section maps, and sections relevant to the Mineral Resources are included in the body of this Report.
|
| Balanced reporting |
No exploration results are being reported as part of this MRE update.
|
| Other substantive exploration data |
No additional exploration data is included in this release.
|
| Further work |
Further work will be focussed on testing and delineation of extensions to known
mineralisation along with infill drilling where applicable for inferred portions of the MRE.
|
Section 3 Estimation and Reporting of Mineral Resources
Henty Gold Mine Deposit
(Criteria listed in section 1, and where relevant in section 2, also apply to this section.)
| Criteria |
Commentary |
| Database integrity |
Current Geological logging was completed onto templates using standardised logging codes.
Analytical results received by CYL are imported directly into the Datashed database by a database specialist.
In the 2023 MRE CSA Global completed numerous checks on the data. Absent collar data, multiple collar entries, suspect downhole survey results, absent survey data, overlapping intervals, negative sample lengths and sample intervals which extended beyond the hole depth defined in the collar table were reviewed. Only minor validation errors were detected which were communicated to CYL and corrected prior to the preparation of the Mineral Resource estimate.
The Henty database to January 31, 2024 comprised 14030 Collar records, 148,306 Survey records, 496,269 Assay records and 186,035 Lithology records.
Historical methods are not known with any certainty; however, the Competent Person considers it is reasonable to assume that industry standard techniques have been adopted over the Project's history.
|
| Site visits |
The Competent Person has undertaken a recent site visit to the Henty Gold Operation. |
| Geological interpretation |
Geological controls on the mineralisation are relatively well understood and have developed over the operating life of the mine. Mineralised zone interpretations were completed by CYL.
Sample intercept logging and assay results from drill core, face sampling and sludge holes form the basis for the geological interpretations. Geological mapping information has also been used to assist with developing the geological interpretations.
Interpretations of domain continuity were undertaken in Datamine software using all available drillholes, face channel samples and sludge holes. Interpretation of each ore domain was constrained by a combination of gold grades (nominally 0.5-1 g/t) and lithology, with individual lenses generally conforming to a particular style of alteration.
Drillhole data spacing varies somewhat over the deposit area. Density of drilling is selected to match the complexity of mineralisation, which is recognised as varying between different domains. Most deposits are drilled out at 10–15 m spacings (along strike and down dip). Drillholes are clustered in some areas, and often become more widely spaced at the edges of the deposits or in areas where the mineralisation is low tenor and delineation of economic material is unlikely.
Alternative interpretations are likely to materially impact on the Mineral Resource estimate on a local but not global basis.
Geological logging and underground mapping have been used to guide the geological interpretations. The controls on the mineralisation are both lithological and structural, and this understanding has governed the resource estimation approach.
|
| Dimensions |
The domains to the north of the Moa fault steeply dip to the west with a thickness of 1-8 m and run semi-parallel to the NNE striking Henty Fault; south of the Moa fault the domains trend from NNE to NE. The mineralisation extends over a strike length (North – South) of approximately 3200 m and currently extends to a depth of approximately 850 m below surface.
|
| Estimation and modelling techniques |
All geological domains used in the MRE were constructed in Datamine software. Block modelling and grade interpolation were carried out using Surpac software. Statistical analysis was carried out using Snowden Supervisor software.
The majority of mineralisation domains used in the MRE were manually constructed in Datamine software. The Z96 geological was constructed using LeapFrog software. Block modelling and grade interpolation were carried out using Surpac software. Statistical analysis was carried out using Snowden Supervisor software.
Block model constraints were created by applying the interpreted mineralised domain wireframes. Sub-celling in all domains was 0.625 m x 0.625 m x 0.625 m to accurately reflect the volumes of the interpreted wireframes.
All drillhole assay samples were uniquely flagged according to the mineralisation domains. All DD, CH and SL samples were composited to 1m downhole using a best-fit methodology and 0.5 m minimum threshold on inclusions. A small number of residual composites were retained in the estimation.
Henty gold mineralisation is hosted in multiple sub-parallel and sub-vertical tabular lenses ranging in strike length from a few tens of meters up to nearly 800m in length. The vertical extent of individual lenses can range from a few tens of meters to 270m vertically. The true width of the lenses ranges from 0.5m to >10m. The Henty March 2024 MRE incorporates the estimation of fifty-five individual mineralised lenses.
The distribution of gold grades within the mineralised lenses is highly variable and is characterised by distinct cohesive regions of higher tenor gold grades, with clusters of individual values often reaching several hundred grams per tonne. Whilst these higher-grade zones appear reasonably cohesive, they are manifested by a high-degree of short-scale variability, making difficult to manually interpret constraining domains. These internal; high-grade regions are often surrounded by peripheral regions of lower grade mineralisation that is also highly variable.
Raw Coefficients of Variation (CoV) are typically in the order of 1.5-3.5, indicating moderate to high grade variability. Some of the more substantial and higher-grade zones such as Z96 have CoV's of greater than 5.
The moderate to high grade variability and complex spatial continuity of high grades at Henty requires a pseudo non-linear approach to deal with these high grades during estimation. A traditional approach of physical domaining, assay cutting, and linear estimation (IDW or OK) is considered inadequate in dealing with this complexity.
The estimation method applied to most of the domains (49) combines Categorical Indicator Kriging (CIK) to define internal estimation sub-domains domains, together with applying distance limiting at chosen grade thresholds to restrict the influence of the high grade and extreme grade values during grade interpolation.
Ordinary Kriging (OK) was used to directly estimate a small number (6) of domains that were either poorly informed with data or where grade variability did not warrant a more sophisticated approach.
Prior to estimation, a reference surface for each estimation domain was exported from the Leapfrog . This is calculated as the best fit surface using the hanging wall and footwall surfaces. The reference surface is then imported into Surpac and a dip and dip-direction of each triangle facets is imported into the Surpac block model to provide information for dynamic search and variogram model orientation during interpolation. Dynamic estimation is applied for estimating the CIK indicators and gold grades.
Categorical Indicator Kriging Workflow
Two Categorical Indicator values are determined for the CIK domains:
A low-grade (LG) indicator of 1.0 g/t Au was assigned to differentiate between background 'waste' and low-tenor mineralisation.
A high-grade (HG) indicator of 5.0 g/t Au was assigned to define broad areas of consistent higher-tenor mineralisation.
Indicator variograms were modelled for the LG and HG thresholds for all mine areas. The indicator variograms for both grade thresholds exhibited a moderate nugget effect of between 20-30%. The LG indicator demonstrated well-structured average continuity of around 35m. The HG indicator demonstrated less well-structured average continuity of around 19m.
The CIK indicators were estimated using Ordinary Kriging into a finely gridded block model with block dimensions of 1.25m x 1.25m x 1.25m. The small block size for the indicator process is beneficial for creating categorical sub-domains at resolution which can be used to accurately back-flag composite data.
Three categorical sub-domains were generated: low-grade (LG), medium-grade (MG) and high-grade (HG) areas. The HG sub-domain was based on an indicator probability threshold of 0.35 and the LG sub-domain was based on an indicator probability threshold of 0.65. The MG sub-domain is assigned to blocks that do not satisfy either the HG or LG sub-domain criteria.
The three categorical block model sub-domains (HG, MG and LG) were used to 'back-flag' the 1m composites from each mine area, thus creating a separate composite file for each sub-domain.
Assay top-cuts are applied to the sub-domain composite files on a domain-by-domain basis and typically in the following ranges:
HG = 15-300 g/t Au
MG = 5-50
g/t Au
LG = 2.5-5 g/t Au
The assay top-cuts were generally between the 97th to 99.9th percentile of the distribution and were aimed at globally limiting extreme values only. Top-cuts are not used as the primary tool to control metal risk. The use of grade thresholds and distance limiting is considered a more objective and influential method in controlling metal risk, while better reflecting the actual localised occurrence of discontinuous high-grade gold mineralisation.
Grade variograms were initially attempted separately for the LG, MG and HG sub-domains, however, this resulted in poorly structured and incoherent variograms. It was decided to use a variogram modelled on the combined grade data for each mine area. The combined grade variograms typically exhibited a moderate nugget effect of between 16% and 38% (average 31%) with a maximum range of continuity of between 21-45m (average 28m).
Grade thresholds for distance limiting were initially determined for each mine area from log-probability plots and visual inspection. Final distance limits were subsequently optimised following a detailed backward-looking mill reconciliation using mine stope voids for the period May 2023 to March 2023 (230Kt). The adjustment of grade distance limits was an iterative process until an acceptable reconciliation with the mill was achieved. The final applied grade distance limits are follows:
0-10 Au
g/t= No Limit
10-25 Au
g/t = 20m
25-50 Au
g/t = 15m
>50 Au
g/t = 7.5m
Prior to grade estimation, sub-domain codes from the 1.25m resolution block model are imported into a 2.5m x 2.5m x 2.5m resolution model and the proportion of LG, MG and HG is calculated for each 2.5m block. Grade estimation for the LG, MG and HG domains was undertaken in Surpac software using Ordinary Kriging with grade threshold distance limiting. Kriging Neighbourhood Analysis (KNA) was undertaken to assist with defining estimation parameters. Search routines and variogram orientations are drawn from the pre-populated dynamic search information recorded in each block.
Final block grades at a 2.5m
x 2.5m x 2.5m block resolution were calculated by weighting the estimated grades for each sub-domain by the relevant domain proportion. The parent estimation block size was 2.5m x 2.5m x 2.5m.
A minimum of 2 and maximum of 12 composites were used for each sub-domain estimate per block.
It is possible that up to 36 composites can be used to estimate a parent block where there is a proportion of all three sib-domains present.
Block discretisation was set at 3 E x 3 N x 3 RL points (per parent block). A standardised single pass search distance of 40-60m was used.
Octant restrictions were not used. Data spacing varied from <10m x 10m to 40m x 20m.
Model validation was completed to check that the grade estimates within the model were an appropriate reflection of the underlying composite sample data, and to confirm that the interpolation parameters were applied as intended. Checks of the estimated block grade with the corresponding composite
dataset were completed using several approaches involving both numerical and spatial aspects.
Ordinary Kriging Workflow
Ordinary Kriging (OK) was used to directly estimate six domains that were either poorly informed with data or where grade variability did not warrant a more sophisticated approach.
All DD, CH and SL samples were composited to 1m downhole using a best-fit methodology and 0.5 m minimum threshold on inclusions. A small number of residual composites were retained in the estimation.
Composite files were statistically analysed in Supervisor software, with assay top cuts defined. Top cuts of between 7.5-15 g/t were applied to the data to control the effects of outlier high grade Au values that were considered not representative. The effect of the top cuts was reviewed with respect to the resulting Mean and CV values.
Kriging Neighbourhood Analysis was undertaken to assess the effect of changing key kriging neighbourhood parameters on block grade estimates. Kriging efficiency and slope of regression were determined for a range of block sizes, minimum/maximum samples, search dimensions and discretisation grids. Variograms were generated using composited top-cut drill data in Snowden Supervisor v8 software.
Within each domain, an Ordinary Kriging estimate of gold grade was produced using the cut composite data. A standardised single pass search distance of 60m was used. Octant restrictions were not used. Hard boundaries were used for the estimate.
To enable the use of dynamic variograms and search orientations during the estimation of gold, the reference surfaces for each domain were exported from the Leapfrog project. This is calculated as the best fit surface using the hanging wall and footwall surfaces.
A minimum of 2 and maximum of 12 (1 m composite) samples per block were used with no limit of samples per drillhole. The minimums and maximums were established through independent KNA on each major domain. Block discretisation was set at 3 E x 3 N x 3 RL points (per parent block).
Octant restrictions were not used, and estimates were into parent blocks, not sub-blocks.
Drill spacing was approximately 20m by 20m or closer. Block dimensions were 2.5m x 2.5m x 2.5m (XYZ).
Model validation was completed to check that the grade estimates within the model were an appropriate reflection of the underlying composite sample data, and to confirm that the interpolation parameters were applied as intended. Checks of the estimated block grade with the corresponding composite dataset were completed using several approaches involving both numerical and spatial aspects.
Model Validation
The model was validated by comparing statistics of the estimated blocks against the composited sample data; visual examination of the of the block grades versus assay data in section and swath plots.
Backward-looking reconciliation of a 233Kt parcel of production feed to the mill between May 2023 and March 2024.
No deleterious elements were estimated or assumed.
Only gold grade was estimated.
|
| Moisture |
All estimations were carried out using a 'dry' basis.
|
| Cut-off parameters |
The Mineral Resource reported inside
Stope Optimiser (SO) shapes above a cut-off grade of 1.50 g/t Au. The adopted cut-off grade is consistent with the current variable cost of underground mining.
|
| Mining factors or assumptions |
In selecting the cut-off grade, it was assumed that the cut-off grade calculated from the variable cost of underground mining will be applicable for future mining activities.
|
| Metallurgical factors or assumptions |
Henty
is
an
operating
mine and
there
are
no
material metallurgical issues that are known to exist.
|
| Environmental factors or assumptions |
Henty
is
an
operating
mine
with
environmental
permits
in
place.
|
| Bulk density |
Bulk density determinations adopted the water displacement method.
Samples were not wax coated prior to immersion. The host lithologies are not porous.
Density has been applied on a global basis as follows:
2.76 g/cm3 for all model areas.
|
| Classification |
Factors considered when classifying the model include:
The portions of the Henty March 2024 MRE classified as Indicated have been flagged in areas of the model where average data spacing is 20m x 20m or closer. The data spacing within the Indicated portion of the resource is appropriate for defining the continuity and volume of the mineralised domains.
The portions of the Henty March 2024 MRE classified as Inferred represent minor areas where geological continuity is present but not consistently confirmed by 20 m x 20 m drilling.
Further considerations of resource classification include; data type and quality (drilling type, drilling orientations, down hole surveys, sampling and assaying methods); geological mapping and understanding; statistical performance including number of samples, kriging quality parameters, mill reconciliation and visual validation.
The Mineral Resource estimate appropriately reflects the view of the Competent Person.
|
| Audits or reviews |
The geological interpretation, estimation parameters and validation of the resource model was peer reviewed by Catalyst staff.
No external reviews of the resource estimate had been carried out at the time of writing.
|
| Discussion of relative accuracy/ confidence |
The relative accuracy of the Mineral Resource estimate is reflected in the reporting of the Mineral Resource as per the guidelines of the 2012 JORC Code.
The statement relates to the global estimates of tonnes and grade.
No collated mine production records were available to enable meaningful comparison with the block model estimates.
|
Section 4 Estimation and Reporting of Ore Reserves
Henty Gold Mine
(Criteria listed in section 1, and where relevant in sections 2 and 3, also apply to this section.)
| Criteria |
Commentary |
| Mineral Resource estimate for conversion to Ore Reserves |
The Mineral Resource Estimate (MRE) used for the estimation of Henty Ore Reserve is as described in section 3. Plutonic East 2024 MRE
Measured 0Mt's @ 0g/t for 0koz.
Indicated 3.7Mt's @ 3.5g/t for 410koz.
Inferred 0.6Mt's @ 2.9g/t for 52koz.
The 2024 MRE was depleted of mined voids (stopes and development) up to end of June 2024 depleted MRE formed the basis of the 2024 ORE. The Measured and Indicated Mineral Resource are reported inclusive of Ore Reserve. The Ore Reserves are a subset of the MRE, and are spatially contained within the MRE. |
| Site visits |
The Competent person is a full-time employee of Catalyst Metals who has visited the Henty Mine site. The competent person has 23+ years in Australian underground mining and mine planning practises with detailed knowledge of mining methods, current industry costs, schedule constraints and other material parameters relating to compiling an Ore Reserve Estimate. |
| Study status |
The Ore Reserves have been determined based on the current operational practises of the Henty operating underground mine. Henty has been in production as an underground operation since 1996. The Ore Reserves were estimated using Deswik software and reported against the updated MRE block model. Modifying factors were applied, and optimised Stope shapes were generated. All physicals were economically evaluated on a stope by stope basis and the total Ore Reserve was evaluated to assess its economic viability. Previous operational performance has demonstrated that the current mining methods are technically achievable and is economically viable. The modifying factors used in the Ore Reserves calculations are based on historically achieved mining dilution and recovery factors. The current mine plan ethos and mining method used currently will continue for future mining. |
| Cut-off parameters |
Stope optimiser shapes were initially categorised by using the operating cut-off grade (1.7g/t). Subsequently, stope shapes that were spatially distant from the mine's footprint were deleted to filter inventory requiring excessive development costs to access.
The operating cut-off grade applied to the Ore Reserve Estimate was:
1.7g/t for stope shapes (after all forms of dilution and ore loss)
1.0g/t for ore development shapes (after applying development profiles to the ore boundary)
Cost and modifying factors used to determine the above COG's were:
Direct underground operating (mining and geology) A$ 90/ore t
Processing A$ 28/ore t
Site G&A A$24/ore t
Metallurgical Recovery 92.0%
Royalties WA State 5.9% NSR (variable using grade recovery curve)
A gold price of A$3,000/oz was used in the assessment.
|
| Mining factors or assumptions |
The Ore Reserves estimate is reported within an underground Shape Optimiser (SO) evaluation from the depleted resource model.
SO input parameters include a 1.7 g/t Au cut-off, Gold price of AUD$3,000/oz, minimum mining width of 1.5m, minimum stope length of 10m. Control strings have been used to control stope height to a maximum of 15m. The intervals vary from 12-15m, which is deemed an appropriate method for control of dilution, reduction of pillars and ore loss, ground control, safety and regional stability. Stable stope dimensions using a maximum HR=4m have been based on geotechnical assessment. The orientation of the SO's is variable depending on the geometry of the minerialisation. Henty has been in operation for 28 years, whereby various mining methods have been used in the past (room and pillar, LHOS with paste fill/ rock fill or no fill) The historic voids have been incorporated into the MRE and coded to ensure the method of fill determines proximity of stope shape generation. The mining method used for the Reserve is a combination of Longhole Stoping and Benching. Unclassified and inferred material have not been included within the Ore Reserves, however if the material is mined as a consequence to mining an Ore Reserve estimated stope, then material had a zero-grade assigned and was therefore treated as dilution waste. The Modifying factors are validated via a reconciliation process. Dilution of 15% is applied to the in-situ stope ore tonnes and the ore recovery of 92-95% is applied, depending on extraction method. Waste development has a 15% dilution factor applied; however Ore development had no dilution applied. Development has 100% mining recovery applied. Recovery and cost estimates are based on actual site operating data and engineering estimates Practical designs have been included for ventilation, power, pumping and drainage as well as second means of egress. Majority of the stopes will be filled using unconsolidated rock fill trucked from surface or underground development waste. This will improve stope stability and increase ore recovery while minimising the backfill costs. Stopes will be filled with waste rock from development where possible to minimise the trucking requirements. |
| Metallurgical factors or assumptions |
The ORE is based on current performance of the Henty CIL circuit. The processing recovery is based on a grade recovery curve, which is then applied to each Stope.
|
| Environmental |
Mining licences / permits are currently granted for Henty Mine. Hentyhas been in operation since 1996 and is operating in compliance with all Environmental restrictions and protocols. Monitoring programs are conducted to ensure key approval and licence requirements are complied with. |
| Infrastructure |
The Plutonic Gold Mine is a well-established mine which has services and infrastructure consistent with an operating mine. The Henty TSF is approved for a further 6m height lift which will allow production through to 2030. |
| Costs |
Capital costs are based on current FY24 costs at Henty Underground, recent quoted assets and / or a budget level cost model.
Operating costs are derived from the operating underground using current FY24 costs and budget models. Allowances have been made for State royalties (5.9%) payable on net revenue. Tasmania operates under a two-tiered system where royalty is paid as a percentage of net sales and of profit. The formula for the payment of royalty is specified in Regulation 7 of the MRR. Royalty is payable at the rate of 1.9% of Net Sales, plus profit. A rebate of up to 20% is available for the production of a metal within the State. Maximum royalty payable is 5.35% of net sales. There is a royalty payable to royalty company Triple Flag of 3% NSR (excluding transport and refining). There is a royalty payable to royalty company Franco-Nevada of 1% of gold metal Surface transport cost based on contracted or quoted rates. Treatment costs reflect the operating Processing Plant.
Cost models use Australian Dollar. |
| Revenue factors |
The Ore Reserve Estimate is generated at $A3,000/oz. |
| Market assessment |
Gold metal is a freely and widely traded commodity with a transparent mechanism for setting prices for sale of gold produced. |
| Economic |
The Henty Operation is economically robust and generates positive cashflow using the afore mentioned costs, revenue factors and a discount rate of 7%. |
| Social |
Catalyst continues to engage with stakeholders of the operation – local community, Shire members and pastoralists. Catalyst is committed to strong environmental and social performance. There are no identified threats that place the company's social licence to operate at risk. |
| Other |
There are no foreseeable risks associated with the Henty Gold Mine which are expected to impact on the ORE. |
| Classification |
The Ore Reserves classification reflects the Competent Person's view of the deposit. Only Probable reserves have been declared and are based on Indicated Resources following consideration of modifying factors. No Proven Ore Reserves are derived from Measured Resources. |
| Audits or reviews |
No reviews or audits have been conducted on the Ore Reserve Estimate. |
| Discussion of relative accuracy/ confidence |
The ORE is based on a robust geological model, 3D design and financial model inputs which are well understood and as such has a corresponding level of confidence.
In the opinion of the Competent person, the Ore Reserve estimate is underpinned with over 28 years of operating experience feeding into an appropriate design, schedule and cost estimate to a feasibility study level or greater. |
SOURCE Catalyst Metals LTD.
WANT YOUR COMPANY'S NEWS FEATURED ON PRNEWSWIRE?
440k+
Newsrooms &
Influencers
9k+
Digital Media
Outlets
270k+
Journalists
Opted In
GET STARTED
MENAFN13092024003732001241ID1108670429