


403
Sorry!!
Error! We're sorry, but the page you were looking for doesn't exist.

How Many Bad Days Do Americans Have Per Month?
(MENAFN- SWNS Digital)
By Marie Haaland // SWNS
NEWS COPY W/ VIDEO + INFOGRAPHIC
By 8:36 a.m., the average American knows if it's going to be a“bad day,” according to new research.
The survey of 2,000 general population Americans revealed that not only do bad days start early in the morning - sometimes there's no saving them.
A quarter of respondents (26%) said when something goes wrong in the morning, they can't turn the day around.
The results also found that the average person has four bad days per month - adding up to over a full month of bad days per year (48).
Commissioned by Avocado Green Mattress and conducted by Talker Research, the survey looked not only at the timing, but it pinpointed the various causes of“bad days” for Americans.
Topping the list was waking up and feeling sick (35%), followed by sleeping poorly throughout the night (31%) or waking up with a headache (29%). 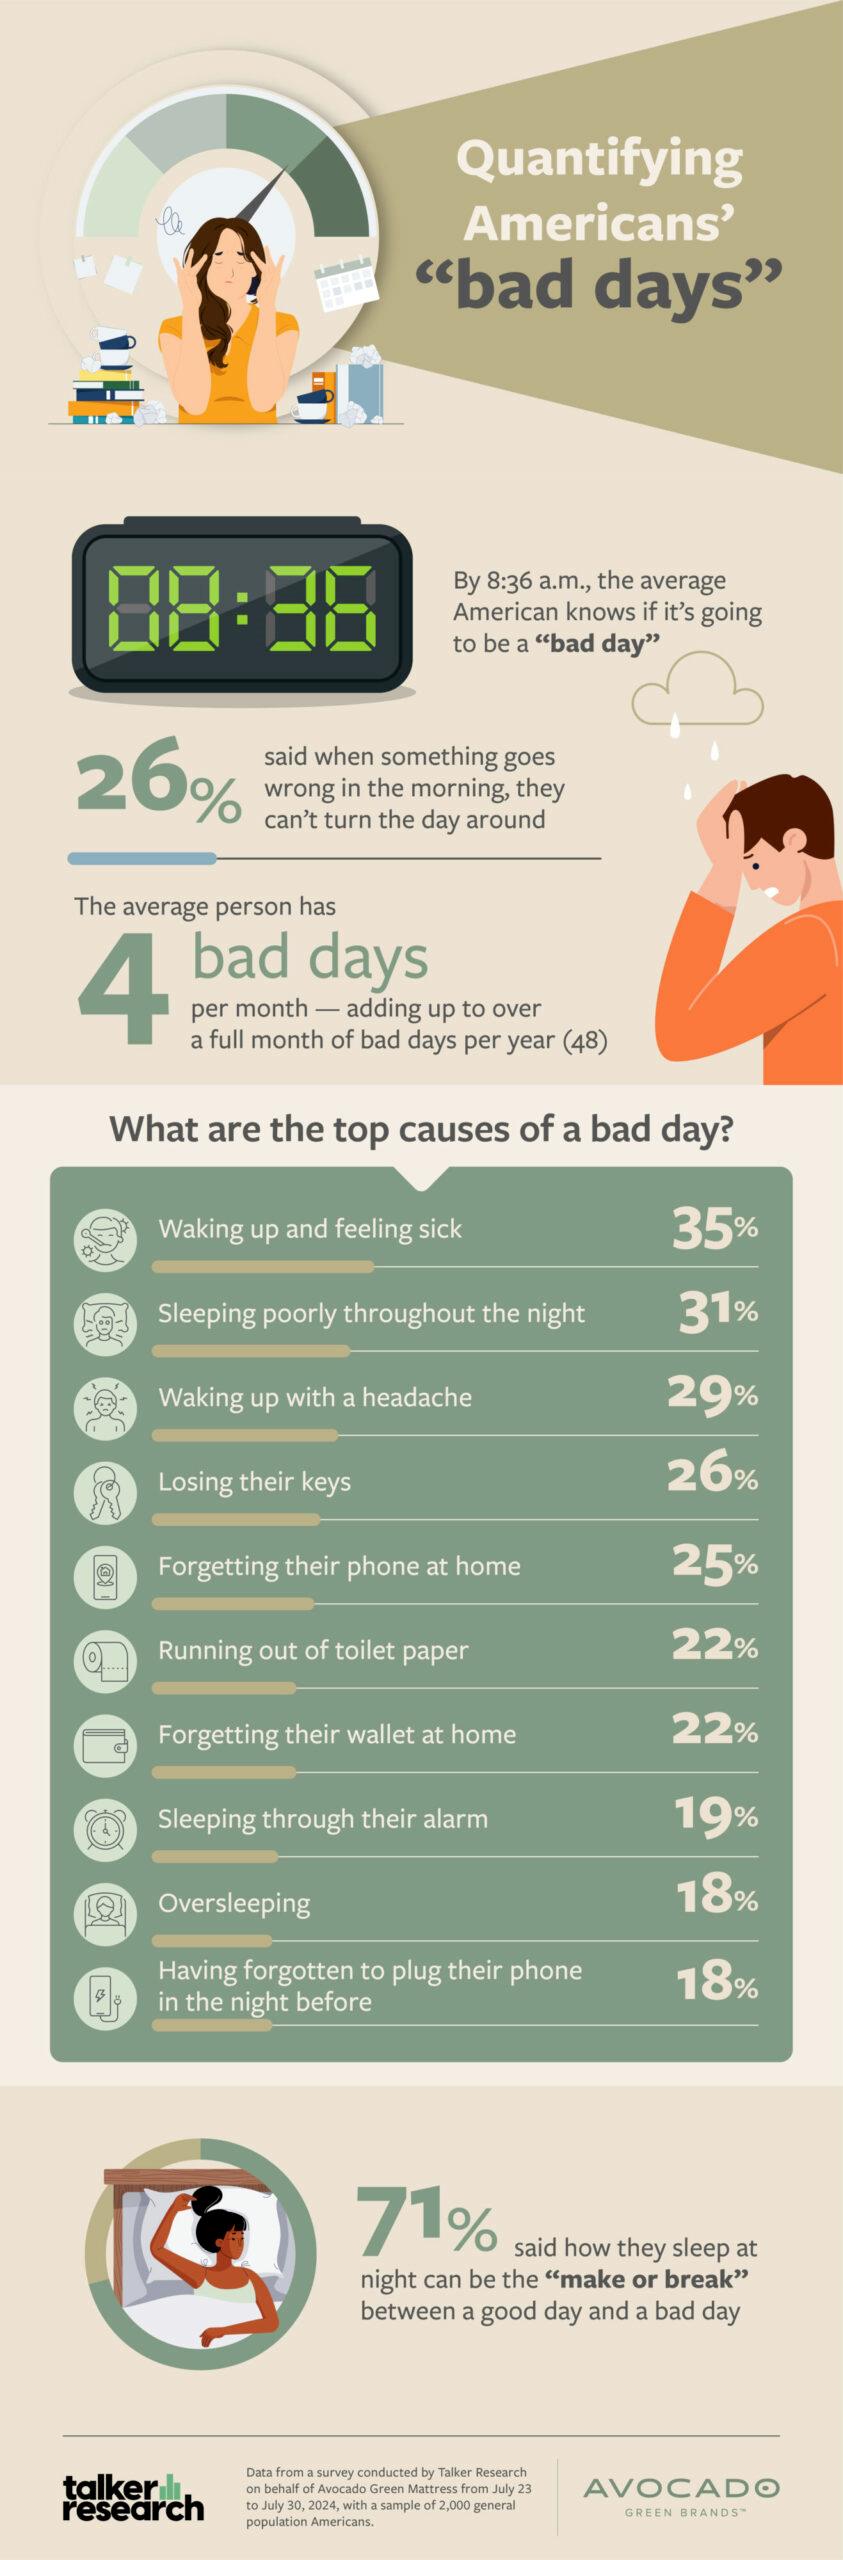
Losing their keys (26%) and forgetting their phone at home (25%) rounded out the top five ways respondents know it'll be a bad day in the morning.
The top 10 causes of a bad day also included running out of toilet paper (22%), forgetting their wallet at home (22%) and sleeping through their alarm (19%).
That's in addition to oversleeping (18%) or forgetting to plug their phone in the night before (18%).
And sometimes, there's no remedy for a bad day except trying to start over: 48% of respondents admit there are times they've woken up feeling like it'll be a bad day - and they've canceled plans or called out of work to go back to sleep.
“Bad days happen to everyone, sometimes from stress or poor sleep,” said Christine Carpio, Sr. Manager, Community + Social Impact.“By focusing on self-care and prioritizing rest, you can turn those tough days into chances for a fresh start and a brighter outlook.”
Unsurprisingly, bad days are most likely to hit at the start of the week. Thirty-six percent of respondents said Mondays are when they're most likely to have a bad day - with Gen Z most likely to agree (50%).
This is likely due to work schedules, with the back-to-school season also a contributing factor.
The survey included almost 500 parents of school-aged children, and it asked how their child and the back-to-school season impacted their“bad days.”
Fifty-five percent said their school-aged child is more likely to have bad days at the start of the school year as they're re-adjusting to the schedule.
But it's not just children who see an increase in bad days: 51% of parents said they, too, have more bad days at the start of the school year.
And those often coincide - as 56% said if their child has a bad day, then they also have a bad day.
Parents or otherwise, the survey asked respondents what they do to prevent bad days from occurring.
The top three things that respondents do are: giving themselves alone time each day to relax (41%), making time each day for things they enjoy (37%) and ensuring they get enough sleep (35%).
In fact, seven in 10 respondents (71%) said how they sleep at night can be the“make or break” between a good day and a bad day.
Not only can a good night's rest be a“make or break,” but sleeping well at night also helps 77% of respondents to be more prepared to deal with things that might go wrong in the morning.
“As we approach the busiest time of the year, from heading back-to-school and into the holiday season, slowing down where possible and prioritizing rest is a great way to prevent bad days,” said Laura Scott, Director of Brand Marketing.
WHAT ARE THE TOP 20 CAUSES OF A“BAD DAY”?
-
Waking up and feeling sick - 35%
Sleeping poorly throughout the night - 31%
Waking up with a headache - 29%
Losing my keys - 26%
Forgetting my phone at home - 25%
Running out of toilet paper - 22%
Forgetting my wallet at home - 22%
Sleeping through my alarm - 19%
Generally oversleeping (not waking up on time/when intended) - 18%
Having forgotten to plug my phone in the night before - 18%
Stubbing my toe - 17%
Waking up on the“wrong side of the bed” - 17%
Forgetting to set my alarm - 17%
Waking up and finding the Wi-Fi is down - 16%
My credit card is declined - 16%
My partner is in a bad mood - 15%
Running out of coffee - 15%
Spilling my coffee in the morning - 14%
Waking up to a mess from the dog/cat (poop, throw-up, etc.) - 14%
Running into traffic - 14%
Survey methodology:
Talker Research surveyed 2,000 general population Americans ; the survey was commissioned by Avocado Green Mattress and administered and conducted online by Talker Research between July 23 and July 30, 2024.
We are sourcing from a non-probability frame and the two main sources we use are:
● Traditional online access panels - where respondents opt-in to take part in online market research for an incentive
● Programmatic - where respondents are online and are given the option to take part in a survey to receive a virtual incentive usually related to the online activity they are engaging in
Those who did not fit the specified sample were terminated from the survey. As the survey is fielded, dynamic online sampling is used, adjusting targeting to achieve the quotas specified as part of the sampling plan.
Regardless of which sources a respondent came from, they were directed to an Online Survey, where the survey was conducted in English; a link to the questionnaire can be shared upon request. Respondents were awarded points for completing the survey. These points have a small cash-equivalent monetary value.
Cells are only reported on for analysis if they have a minimum of 80 respondents, and statistical significance is calculated at the 95% level. Data is not weighted, but quotas and other parameters are put in place to reach the desired sample.
Interviews are excluded from the final analysis if they failed quality-checking measures. This includes:
● Speeders: Respondents who complete the survey in a time that is quicker than one-third of the median length of interview are disqualified as speeders
● Open ends: All verbatim responses (full open-ended questions as well as other please specify options) are checked for inappropriate or irrelevant text
● Bots: Captcha is enabled on surveys, which allows the research team to identify and disqualify bots
● Duplicates: Survey software has“deduping” based on digital fingerprinting, which ensures nobody is allowed to take the survey more than once
It is worth noting that this survey was only available to individuals with internet access, and the results may not be generalizable to those without internet access.

Legal Disclaimer:
MENAFN provides the
information “as is” without warranty of any kind. We do not accept
any responsibility or liability for the accuracy, content, images,
videos, licenses, completeness, legality, or reliability of the information
contained in this article. If you have any complaints or copyright
issues related to this article, kindly contact the provider above.
Most popular stories
Market Research

More Story


Comments
No comment