BTC/USD Signal Today 15/05: Consolidating Above $60K (Chart)
Date
5/18/2024 1:48:34 AM
(MENAFN- Daily Forex) My previous BTC/USD signal last Thursday could have produced a profitable long trade from the bullish bounce off $60,765's BTC/USD Signals
Risk 0.75% per trade. Trades may only be taken prior to 5pm Tokyo time Thursday.
Long Trade Ideas
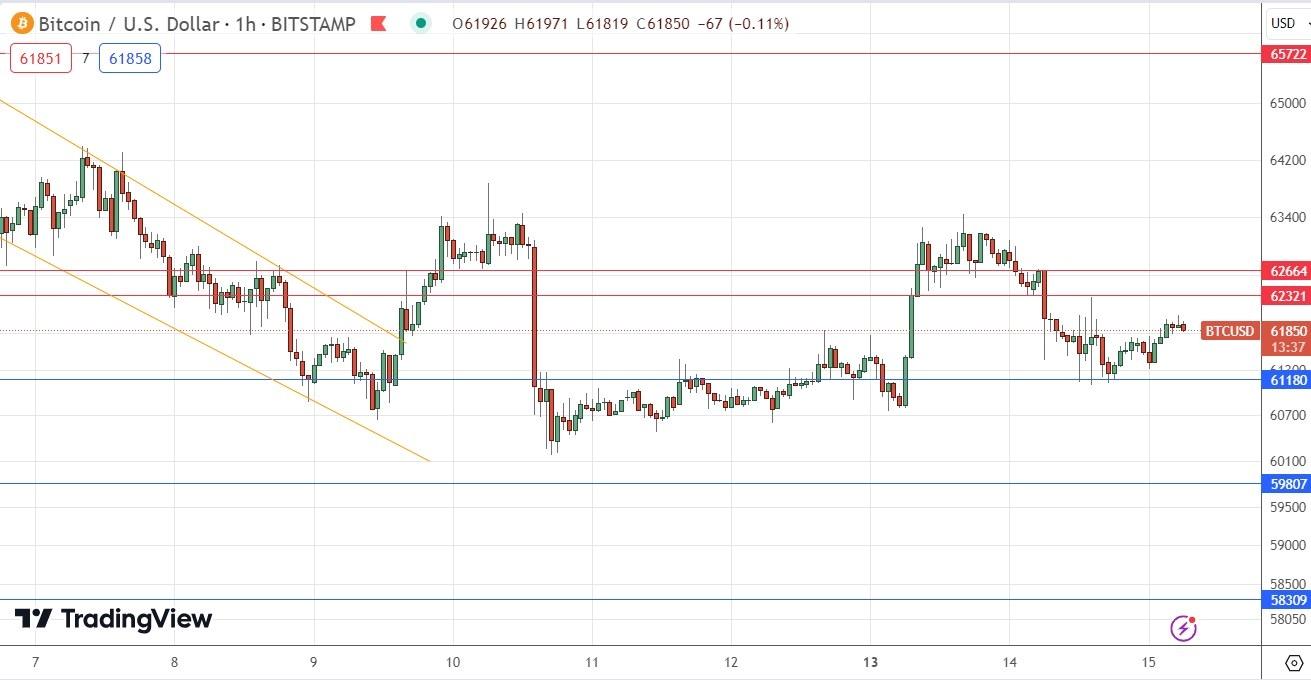
Go long after a bullish price action reversal on the H1 timeframe following the next touch of $61,180, $59,807, or $58,309. Put the stop loss $100 below the local swing low. Move the stop loss to break even once the trade is $100 in profit by price. Take off 50% of the position as profit when the trade is $100 in profit by price and leave the remainder of the position to run.
Short Trade Ideas
Go short after a bearish price action reversal on the H1 timeframe following the next touch of $62,321, $62,664, or $65,722. Put the stop loss $100 above the local swing high. Move the stop loss to break even once the trade is $100 in profit by price. Take off 50% of the position as profit when the trade is $100 in profit by price and leave the remainder of the position to run.
The best method to identify a classic“price action reversal” is for an hourly candle to close, such as a pin bar , a doji , an outside or even just an engulfing candle with a higher close. You can exploit these levels or zones by watching the
price action
that occurs at the given levels.
Top Forex Brokers
1 Get Started 74% of retail CFD accounts lose money
BTC/USD Analysis
I wrote in my previous BTC/USD analysis last Thursday that the short-term bearish price channel was pushing the price lower – and the topping out price action near the recent swing high around $65,000 looked bearish too.
This was not an especially accurate or useful call, as although the price continued to move down for a few hours, it found strong support and rose firmly to make a higher high. This then turned into a consolidation pattern, which is what we have seen continue for almost one week now.
Despite this consolidation which suggest we may now see a slow reversal and more bullish price action, zooming out to look at a longer-term price chart still looks bearish due to the recent topping price action.
I think the lows of the recent week just above the big round number at $60,000 look very pivotal. A bearish breakdown below that area could be a great entry trigger for a new short trade.
On the other hand, a bullish breakout beyond $63,400 could produce a much stronger upwards price movement, as the price would then have room to rise all the way to $65,722 without encountering any obvious resistance.
Regarding the US Dollar, there will be release of US CPI , Retail Sales, and Empire State Manufacturing Index data at 1:30pm London time.
Ready to trade our daily Bitcoin signals ? Here's our list of the best crypto brokers worth checking out.
MENAFN18052024000131011023ID1108228511

Legal Disclaimer:
MENAFN provides the information “as is” without warranty of any kind. We do not accept any responsibility or liability for the accuracy, content, images, videos, licenses, completeness, legality, or reliability of the information contained in this article. If you have any complaints or copyright issues related to this article, kindly contact the provider above.