(MENAFN- PR Newswire) NEW YORK, Feb. 3, 2023 /PRNewswire/ -- Technavio report provides the
key offerings of 15+ vendors of the
diagnostic wearable medical devices market. For instance, one of the key vendors,
AliveCor Inc
offers medical wearable devices such as KardiaMobile. Similarly, another vendor,
Alphabet Inc provides
medical wearable devices such as Fitbit sense 2, Fitbit versa 4, and Fitbit charge 5. To know about all major vendor offerings,
download a pdf sample report .
continue reading
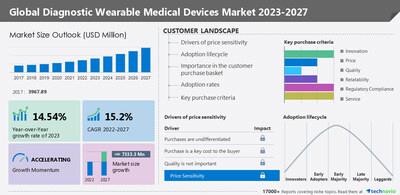
Technavio has announced its latest market research report titled Global Diagnostic Wearable Medical Devices Market 2023-2027
The diagnostic wearable medical devices market by application, device, and geography - forecast and analysis 2023-2027 report has been published by Technavio. Market growth is estimated to accelerate at a CAGR of 15.2% and register an incremental growth of
USD 7,333.3 million during the forecast period. The report provides a comprehensive analysis of growth opportunities at regional levels, new product launches, the latest trends, and the post-pandemic recovery of the global market.
Regional Analysis
By region, the global diagnostic wearable medical devices market is segmented into North America, Europe, Asia, and the Rest of World (ROW) . North America will account for 37% of the market's growth during the forecast period. The increase in the incidence of chronic diseases among people of all ages, the increased prevalence of heart and respiratory disorders, and a rise in the number of premature births are driving the growth of the regional market. For more insights,
buy the report!
Market dynamics
The market is driven by factors such as the growing demand for early diagnosis and preventive medicine, the increasing prevalence of chronic diseases, and the increased need for cost-effective diagnosis. However, data privacy issues are hindering market growth.
Competitive analysis
The competitive scenario categorizes companies based on various performance indicators. Some of the factors considered include the financial performance of companies over the past few years, growth strategies, product innovations, new product launches, investments, and growth in market share, among others. request a sample .
Market segmentation
By application , the market is segmented into home healthcare, sports and fitness, and remote patient monitoring .
The home healthcare segment accounted for the largest share of the market during the forecast period. By geography, the market is segmented into North America, Europe, Asia, and the Rest of World (ROW) . North America held the largest share of the market in 2021.
Related Reports:
echocardiography (ecg) devices market by End-user, Product and Geography - Forecast and Analysis 2023-2027: The echocardiography (ECG) devices market is estimated to grow at a
CAGR of 5.7%
between 2022 and 2027. The size of the market is forecast to increase by
USD 4,102.12 million. The increased incidence of cardiac disorders is notably driving the market growth, although factors such as the high cost of ECG products and procedures
may impede
the market growth.
breast biopsy devices market
by Product, End-user, Modality, and Geography - Forecast and Analysis 2023-2027: The breast biopsy devices market is estimated to grow at a
CAGR of 10.95%
between 2022 and 2027. The size of the market is forecast to increase by
USD
721.64 million . The growing prevalence of breast cancer cases is notably driving the market growth, although factors such as the high cost of breast biopsy may impede the market growth.
Technavio's library includes over 17,000+ reports, covering more than 2,000 emerging technologies. subscribe to our 'basic plan' at just usd 5,000 and get lifetime access to technavio insights
What are the key data covered in this diagnostic wearable medical devices market report?
CAGR of the market during the forecast period Detailed information on factors that will drive the growth of the
diagnostic wearable medical devices market between 2023 and 2027 Precise estimation of the size of the diagnostic wearable medical devices market and its contribution to the parent market Accurate predictions about
upcoming trends and changes in consumer behavior Growth of the diagnostic wearable medical devices market across North America, Europe, Asia, and Rest of World (ROW) A thorough analysis of the market's competitive landscape and detailed information about vendors Comprehensive analysis of factors that will challenge the growth of diagnostic wearable medical devices market vendors
| Diagnostic Wearable Medical Devices Market Scope |
| Report Coverage | Details |
| Page number | 173 |
| Base year | 2022 |
| Historic period | 2017-2021 |
| Forecast period | 2023-2027 |
| Growth momentum & CAGR | Accelerate at a CAGR of 15.2% |
| Market growth 2023-2027 | USD 7333.3 million |
| Market structure | Fragmented |
| YoY growth 2022-2023 (%) | 14.54 |
| Regional analysis | North America, Europe, Asia, and Rest of World (ROW) |
| Performing market contribution | North America at 37% |
| Key countries | US, Germany, UK, China, and Japan |
| Competitive landscape | Leading Vendors, Market Positioning of Vendors, Competitive Strategies, and Industry Risks |
| Key companies profiled | Activinsights Ltd., AliveCor Inc., Alphabet Inc., BTS Bioengineering Corp., Cleveland Medical Devices Inc., Draegerwerk AG and Co. KGaA, Garmin Ltd, Intelesens Ltd., Koninklijke Philips NV, Medtronic Plc, OMRON Corp., Polar Electro Oy, ResMed Inc., Smart Solutions Technologies SL, VitalConnect Inc., Wellue Health, and World Global Network |
| Market dynamics | Parent Market Analysis; Market growth inducers and obstacles; Fast-growing and slow-growing segment analysis for the forecast period |
| Customization purview | If our report has not included the data that you are looking for, you can reach out to our analysts and get segments customized. |
Browse for Technavio ' health care ' Research Reports
Table of Contents
1 Executive Summary
1.1 Market overview
Exhibit 01: Executive Summary – Chart on Market Overview Exhibit 02: Executive Summary – Data Table on Market Overview Exhibit 03: Executive Summary – Chart on Global Market Characteristics Exhibit 04: Executive Summary – Chart on Market by Geography Exhibit 05: Executive Summary – Chart on Market Segmentation by Application Exhibit 06: Executive Summary – Chart on Market Segmentation by Device Exhibit 07: Executive Summary – Chart on Incremental Growth Exhibit 08: Executive Summary – Data Table on Incremental Growth Exhibit 09: Executive Summary – Chart on Vendor Market Positioning
2 Market Landscape
2.1 Market ecosystem
Exhibit 10: Parent market Exhibit 11: Market Characteristics
3 Market Sizing
3.1 Market definition
Exhibit 12: Offerings of vendors included in the market definition
3.2 Market segment analysis
Exhibit 13: Market segments
3.4 Market outlook: Forecast for 2022-2027
Exhibit 14: Chart on Global - Market size and forecast 2022-2027 ($ million) Exhibit 15: Data Table on Global - Market size and forecast 2022-2027 ($ million) Exhibit 16: Chart on Global Market: Year-over-year growth 2022-2027 (%) Exhibit 17: Data Table on Global Market: Year-over-year growth 2022-2027 (%)
4 Historic Market Size
4.1 Global diagnostic wearable medical devices market 2017 - 2021
Exhibit 18: Historic Market Size – Data Table on Global diagnostic wearable medical devices market 2017 - 2021 ($ million)
4.2 Application Segment Analysis 2017 - 2021 Exhibit 19: Historic Market Size – Application Segment 2017 - 2021 ($ million)
4.3 Device Segment Analysis 2017 - 2021
Exhibit 20: Historic Market Size – Device Segment 2017 - 2021 ($ million)
4.4 Geography Segment Analysis 2017 - 2021
Exhibit 21: Historic Market Size – Geography Segment 2017 - 2021 ($ million)
4.5 Country Segment Analysis 2017 - 2021
Exhibit 22: Historic Market Size – Country Segment 2017 - 2021 ($ million)
5 Five Forces Analysis
5.1 Five forces summary
Exhibit 23: Five forces analysis - Comparison between 2022 and 2027
5.2 Bargaining power of buyers
Exhibit 24: Chart on Bargaining power of buyers – Impact of key factors 2022 and 2027
5.3 Bargaining power of suppliers
Exhibit 25: Bargaining power of suppliers – Impact of key factors in 2022 and 2027
5.4 Threat of new entrants
Exhibit 26: Threat of new entrants – Impact of key factors in 2022 and 2027
5.5 Threat of substitutes
Exhibit 27: Threat of substitutes – Impact of key factors in 2022 and 2027
5.6 Threat of rivalry
Exhibit 28: Threat of rivalry – Impact of key factors in 2022 and 2027
5.7 Market condition
Exhibit 29: Chart on Market condition - Five forces 2022 and 2027
6 Market Segmentation by Application
6.1 Market segments
Exhibit 30: Chart on Application - Market share 2022-2027 (%) Exhibit 31: Data Table on Application - Market share 2022-2027 (%)
6.2 Comparison by Application
Exhibit 32: Chart on Comparison by Application Exhibit 33: Data Table on Comparison by Application
6.3 Home healthcare - Market size and forecast 2022-2027 Exhibit 34: Chart on Home healthcare - Market size and forecast 2022-2027 ($ million) Exhibit 35: Data Table on Home healthcare - Market size and forecast 2022-2027 ($ million) Exhibit 36: Chart on Home healthcare - Year-over-year growth 2022-2027 (%) Exhibit 37: Data Table on Home healthcare - Year-over-year growth 2022-2027 (%)
6.4 Sports and fitness - Market size and forecast 2022-2027 Exhibit 38: Chart on Sports and fitness - Market size and forecast 2022-2027 ($ million) Exhibit 39: Data Table on Sports and fitness - Market size and forecast 2022-2027 ($ million) Exhibit 40: Chart on Sports and fitness - Year-over-year growth 2022-2027 (%) Exhibit 41: Data Table on Sports and fitness - Year-over-year growth 2022-2027 (%)
6.5 Remote patient monitoring - Market size and forecast 2022-2027
Exhibit 42: Chart on Remote patient monitoring - Market size and forecast 2022-2027 ($ million) Exhibit 43: Data Table on Remote patient monitoring - Market size and forecast 2022-2027 ($ million) Exhibit 44: Chart on Remote patient monitoring - Year-over-year growth 2022-2027 (%) Exhibit 45: Data Table on Remote patient monitoring - Year-over-year growth 2022-2027 (%)
6.6 Market opportunity by Application
Exhibit 46: Market opportunity by Application ($ million)
7 Market Segmentation by Device
7.1 Market segments
Exhibit 47: Chart on Device - Market share 2022-2027 (%) Exhibit 48: Data Table on Device - Market share 2022-2027 (%)
7.2 Comparison by Device
Exhibit 49: Chart on Comparison by Device Exhibit 50: Data Table on Comparison by Device
7.3 Vital signs monitors - Market size and forecast 2022-2027 Exhibit 51: Chart on Vital signs monitors - Market size and forecast 2022-2027 ($ million) Exhibit 52: Data Table on Vital signs monitors - Market size and forecast 2022-2027 ($ million) Exhibit 53: Chart on Vital signs monitors - Year-over-year growth 2022-2027 (%) Exhibit 54: Data Table on Vital signs monitors - Year-over-year growth 2022-2027 (%)
7.4 Sleep and activity monitors - Market size and forecast 2022-2027
Exhibit 55: Chart on Sleep and activity monitors - Market size and forecast 2022-2027 ($ million) Exhibit 56: Data Table on Sleep and activity monitors - Market size and forecast 2022-2027 ($ million) Exhibit 57: Chart on Sleep and activity monitors - Year-over-year growth 2022-2027 (%) Exhibit 58: Data Table on Sleep and activity monitors - Year-over-year growth 2022-2027 (%)
7.5 Fetal and obstetric monitoring devices - Market size and forecast 2022-2027
Exhibit 59: Chart on Fetal and obstetric monitoring devices - Market size and forecast 2022-2027 ($ million) Exhibit 60: Data Table on Fetal and obstetric monitoring devices - Market size and forecast 2022-2027 ($ million) Exhibit 61: Chart on Fetal and obstetric monitoring devices - Year-over-year growth 2022-2027 (%) Exhibit 62: Data Table on Fetal and obstetric monitoring devices - Year-over-year growth 2022-2027 (%)
7.6 Neuromonitoring devices - Market size and forecast 2022-2027
Exhibit 63: Chart on Neuromonitoring devices - Market size and forecast 2022-2027 ($ million) Exhibit 64: Data Table on Neuromonitoring devices - Market size and forecast 2022-2027 ($ million) Exhibit 65: Chart on Neuromonitoring devices - Year-over-year growth 2022-2027 (%) Exhibit 66: Data Table on Neuromonitoring devices - Year-over-year growth 2022-2027 (%)
7.7 ECG monitors - Market size and forecast 2022-2027 Exhibit 67: Chart on ECG monitors - Market size and forecast 2022-2027 ($ million) Exhibit 68: Data Table on ECG monitors - Market size and forecast 2022-2027 ($ million) Exhibit 69: Chart on ECG monitors - Year-over-year growth 2022-2027 (%) Exhibit 70: Data Table on ECG monitors - Year-over-year growth 2022-2027 (%)
7.8 Market opportunity by Device
Exhibit 71: Market opportunity by Device ($ million)
8 Customer Landscape
8.1 Customer landscape overview
Exhibit 72: Analysis of price sensitivity, lifecycle, customer purchase basket, adoption rates, and purchase criteria
9 Geographic Landscape
9.1 Geographic segmentation
Exhibit 73: Chart on Market share by geography 2022-2027 (%) Exhibit 74: Data Table on Market share by geography 2022-2027 (%)
9.2 Geographic comparison
Exhibit 75: Chart on Geographic comparison Exhibit 76: Data Table on Geographic comparison
9.3 North America - Market size and forecast 2022-2027 Exhibit 77: Chart on North America - Market size and forecast 2022-2027 ($ million) Exhibit 78: Data Table on North America - Market size and forecast 2022-2027 ($ million) Exhibit 79: Chart on North America - Year-over-year growth 2022-2027 (%) Exhibit 80: Data Table on North America - Year-over-year growth 2022-2027 (%)
9.4 Europe - Market size and forecast 2022-2027 Exhibit 81: Chart on Europe - Market size and forecast 2022-2027 ($ million) Exhibit 82: Data Table on Europe - Market size and forecast 2022-2027 ($ million) Exhibit 83: Chart on Europe - Year-over-year growth 2022-2027 (%) Exhibit 84: Data Table on Europe - Year-over-year growth 2022-2027 (%)
9.5 Asia - Market size and forecast 2022-2027 Exhibit 85: Chart on Asia - Market size and forecast 2022-2027 ($ million) Exhibit 86: Data Table on Asia - Market size and forecast 2022-2027 ($ million) Exhibit 87: Chart on Asia - Year-over-year growth 2022-2027 (%) Exhibit 88: Data Table on Asia - Year-over-year growth 2022-2027 (%)
9.6 Rest of World (ROW) - Market size and forecast 2022-2027 Exhibit 89: Chart on Rest of World (ROW) - Market size and forecast 2022-2027 ($ million) Exhibit 90: Data Table on Rest of World (ROW) - Market size and forecast 2022-2027 ($ million) Exhibit 91: Chart on Rest of World (ROW) - Year-over-year growth 2022-2027 (%) Exhibit 92: Data Table on Rest of World (ROW) - Year-over-year growth 2022-2027 (%)
9.7 US - Market size and forecast 2022-2027 Exhibit 93: Chart on US - Market size and forecast 2022-2027 ($ million) Exhibit 94: Data Table on US - Market size and forecast 2022-2027 ($ million) Exhibit 95: Chart on US - Year-over-year growth 2022-2027 (%) Exhibit 96: Data Table on US - Year-over-year growth 2022-2027 (%)
9.8 China - Market size and forecast 2022-2027 Exhibit 97: Chart on China - Market size and forecast 2022-2027 ($ million) Exhibit 98: Data Table on China - Market size and forecast 2022-2027 ($ million) Exhibit 99: Chart on China - Year-over-year growth 2022-2027 (%) Exhibit 100: Data Table on China - Year-over-year growth 2022-2027 (%)
9.9 UK - Market size and forecast 2022-2027 Exhibit 101: Chart on UK - Market size and forecast 2022-2027 ($ million) Exhibit 102: Data Table on UK - Market size and forecast 2022-2027 ($ million) Exhibit 103: Chart on UK - Year-over-year growth 2022-2027 (%) Exhibit 104: Data Table on UK - Year-over-year growth 2022-2027 (%)
9.10 Germany - Market size and forecast 2022-2027 Exhibit 105: Chart on Germany - Market size and forecast 2022-2027 ($ million) Exhibit 106: Data Table on Germany - Market size and forecast 2022-2027 ($ million) Exhibit 107: Chart on Germany - Year-over-year growth 2022-2027 (%) Exhibit 108: Data Table on Germany - Year-over-year growth 2022-2027 (%)
9.11 Japan - Market size and forecast 2022-2027 Exhibit 109: Chart on Japan - Market size and forecast 2022-2027 ($ million) Exhibit 110: Data Table on Japan - Market size and forecast 2022-2027 ($ million) Exhibit 111: Chart on Japan - Year-over-year growth 2022-2027 (%) Exhibit 112: Data Table on Japan - Year-over-year growth 2022-2027 (%)
9.12 Market opportunity by geography
Exhibit 113: Market opportunity by geography ($ million)
10 Drivers, Challenges, and Trends
10.3 Impact of drivers and challenges
Exhibit 114: Impact of drivers and challenges in 2022 and 2027
11 Vendor Landscape
11.2 Vendor landscape
Exhibit 115: Overview on Criticality of inputs and Factors of differentiation
11.3 Landscape disruption
Exhibit 116: Overview on factors of disruption
11.4 Industry risks
Exhibit 117: Impact of key risks on business
12 Vendor Analysis
12.1 Vendors covered
Exhibit 118: Vendors covered
12.2 Market positioning of vendors
Exhibit 119: Matrix on vendor position and classification
12.3 Activinsights Ltd.
Exhibit 120: Activinsights Ltd. - Overview Exhibit 121: Activinsights Ltd. - Product / Service Exhibit 122: Activinsights Ltd. - Key offerings
12.4 AliveCor Inc.
Exhibit 123: AliveCor Inc. - Overview Exhibit 124: AliveCor Inc. - Product / Service Exhibit 125: AliveCor Inc. - Key offerings
12.5 Alphabet Inc.
Exhibit 126: Alphabet Inc. - Overview Exhibit 127: Alphabet Inc. - Business segments Exhibit 128: Alphabet Inc. - Key news Exhibit 129: Alphabet Inc. - Key offerings Exhibit 130: Alphabet Inc. - Segment focus
12.6 BTS Bioengineering Corp.
Exhibit 131: BTS Bioengineering Corp. - Overview Exhibit 132: BTS Bioengineering Corp. - Product / Service Exhibit 133: BTS Bioengineering Corp. - Key offerings
12.7 Cleveland Medical Devices Inc.
Exhibit 134: Cleveland Medical Devices Inc. - Overview Exhibit 135: Cleveland Medical Devices Inc. - Product / Service Exhibit 136: Cleveland Medical Devices Inc. - Key offerings
12.8 Draegerwerk AG and Co. KGaA
Exhibit 137: Draegerwerk AG and Co. KGaA - Overview Exhibit 138: Draegerwerk AG and Co. KGaA - Business segments Exhibit 139: Draegerwerk AG and Co. KGaA - Key offerings Exhibit 140: Draegerwerk AG and Co. KGaA - Segment focus
12.9 Garmin Ltd
Exhibit 141: Garmin Ltd - Overview Exhibit 142: Garmin Ltd - Business segments Exhibit 143: Garmin Ltd - Key offerings Exhibit 144: Garmin Ltd - Segment focus
12.10 Koninklijke Philips NV
Exhibit 145: Koninklijke Philips NV - Overview Exhibit 146: Koninklijke Philips NV - Business segments Exhibit 147: Koninklijke Philips NV - Key news Exhibit 148: Koninklijke Philips NV - Key offerings Exhibit 149: Koninklijke Philips NV - Segment focus
12.11 Medtronic Plc
Exhibit 150: Medtronic Plc - Overview Exhibit 151: Medtronic Plc - Business segments Exhibit 152: Medtronic Plc - Key news Exhibit 153: Medtronic Plc - Key offerings Exhibit 154: Medtronic Plc - Segment focus
12.12 OMRON Corp.
Exhibit 155: OMRON Corp. - Overview Exhibit 156: OMRON Corp. - Business segments Exhibit 157: OMRON Corp. - Key news Exhibit 158: OMRON Corp. - Key offerings Exhibit 159: OMRON Corp. - Segment focus
12.13 Polar Electro Oy
Exhibit 160: Polar Electro Oy - Overview Exhibit 161: Polar Electro Oy - Product / Service Exhibit 162: Polar Electro Oy - Key offerings
12.14 ResMed Inc.
Exhibit 163: ResMed Inc. - Overview Exhibit 164: ResMed Inc. - Business segments Exhibit 165: ResMed Inc. - Key news Exhibit 166: ResMed Inc. - Key offerings Exhibit 167: ResMed Inc. - Segment focus
12.15 VitalConnect Inc.
Exhibit 168: VitalConnect Inc. - Overview Exhibit 169: VitalConnect Inc. - Product / Service Exhibit 170: VitalConnect Inc. - Key offerings
12.16 Wellue Health
Exhibit 171: Wellue Health - Overview Exhibit 172: Wellue Health - Product / Service Exhibit 173: Wellue Health - Key offerings
12.17 World Global Network
Exhibit 174: World Global Network - Overview Exhibit 175: World Global Network - Product / Service Exhibit 176: World Global Network - Key offerings
13 Appendix
13.2 Inclusions and exclusions checklist
Exhibit 177: Inclusions checklist Exhibit 178: Exclusions checklist
13.3 Currency conversion rates for US$
Exhibit 179: Currency conversion rates for US$
13.4 Research methodology
Exhibit 180: Research methodology Exhibit 181: Validation techniques employed for market sizing Exhibit 182: Information sources
13.5 List of abbreviations
Exhibit 183: List of abbreviations
About Us
Technavio is a leading global technology research and advisory company. Their research and analysis focus on emerging market trends and provides actionable insights to help businesses identify market opportunities and develop effective strategies to optimize their market positions. With over 500 specialized analysts, Technavio's report library consists of more than 17,000 reports and counting, covering 800 technologies, spanning across 50 countries. Their client base consists of enterprises of all sizes, including more than 100 Fortune 500 companies. This growing client base relies on Technavio's comprehensive coverage, extensive research, and actionable market insights to identify opportunities in existing and potential markets and assess their competitive positions within changing market scenarios.
Contact
Technavio Research
Jesse Maida
Media & Marketing Executive
US: +1 844 364 1100
UK: +44 203 893 3200
Email: [email protected]
Website:
SOURCE Technavio