(MENAFN- PR Newswire) NEW YORK, Oct. 12, 2022 /PRNewswire/ -- The report has been added to Technavio's offering. With ISO 9001:2015 certification, Technavio is proudly partnering with more than 100 Fortune 500 companies for over 16 years. The potential growth difference for the aluminum smelting market between 2021 and 2026 is USD 26.99 billion. To get the exact yearly growth variance and the Y-O-Y growth rate,
Key Market Dynamics:
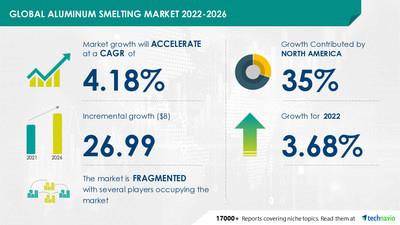
Technavio has announced its latest market research report titled Global Aluminum Smelting Market 2022-2026
Market Driver Market Challenges
One of the key factors influencing the growth of the aluminum smelting market is the high demand for aluminum wire rods. Aluminum is a vital metal that is used frequently because of its durability, lightweight, and strength. It is a recyclable substance that is used to create low-emission vehicles, smartphones, zippers, and foil. The wiring that connects electrical grids to different end users, including businesses, apartment buildings, and other kinds of residential structures, is also made of metal.
Due to its adaptability, aluminum is currently used in a wide range of applications, one of which is aluminum wire rods. Therefore, it is anticipated that over the projected period, the growing use of aluminum wire rods in various sectors will propel the expansion of the worldwide aluminum smelting market.
Aluminum Smelting Market Segmentation
The high demand for aluminum wire rods and the growth of the automotive industry are some of the key market drivers. However, factors such as stringent government regulations hampering market growth will challenge market growth. The aluminum smelting market report is segmented by Type (ingots, billets, and wire rods), End-user (transportation, heavy machinery and industrial, construction, and others), and Geography (North America, Europe, APAC, South America, and Middle East and Africa). North America will be the leading region with 35% of the market's growth during the forecast period.
Aluminum Smelting Market Vendors
The growing competition in the market is compelling vendors to adopt various growth strategies such as promotional activities and spending on advertisements to improve the visibility of their services. Some vendors are also adopting inorganic growth strategies such as M&As to remain competitive in the market.
The report analyzes the market's competitive landscape and offers information on several market vendors, including:
AECOM Alcoa Corp. Aleris International Inc. Aluar Aluminum Crop. of China Ltd. AMAG Austria Metall AG BlueScope Steel Ltd. Capral Ltd. China Hongqiao Group Ltd. Constellium SE Garmco Golden Aluminum United Company RUSAL
To gain access to more vendor profiles with their key offerings available with Technavio,
Related Reports
by Application and Geography - Forecast and Analysis 2022-2026: The Ti-6Al-4V Titanium Alloy Market is projected to grow by USD 707.41 million with a CAGR of 3.05% during the forecast period 2021 to 2026.
by End-user, Type, and Geography - Forecast and Analysis 2022-2026: The zeolite market share is expected to increase by USD 3.94 billion from 2022 to 2026, and the market's growth momentum will accelerate at a CAGR of 6.2%.
| Aluminum Smelting Market Scope |
| Report Coverage | Details |
| Page number | 120 |
| Base year | 2021 |
| Forecast period | 2022-2026 |
| Growth momentum & CAGR | Accelerate at a CAGR of 4.18% |
| Market growth 2022-2026 | $26.99 billion |
| Market structure | Fragmented |
| YoY growth (%) | 3.68 |
| Regional analysis | North America, Europe, APAC, South America, and Middle East and Africa |
| Performing market contribution | North America at 35% |
| Key consumer countries | US, China, Japan, France, and Germany |
| Competitive landscape | Leading companies, competitive strategies, consumer engagement scope |
| Companies profiled | AECOM, Alcoa Corp., Aleris International Inc., Aluar, Aluminum Crop. of China Ltd., AMAG Austria Metall AG, BlueScope Steel Ltd., Capral Ltd., China Hongqiao Group Ltd., Constellium SE, Garmco, Golden Aluminum, Kaiser Aluminum Corp., Kobe Steel Ltd., Nanshan Group Singapore Co. Pte. Ltd., Norsk Hydro ASA, Novelis Inc., Rio Tinto Ltd, SHOWA DENKO K.K., and United Company RUSAL |
| Market Dynamics | Parent market analysis, Market growth inducers and obstacles, Fast-growing and slow-growing segment analysis, COVID-19 impact and future consumer dynamics, and market condition analysis for the forecast period. |
| Customization purview | If our report has not included the data that you are looking for, you can reach out to our analysts and get segments customized. |
Table of Contents
1 Executive Summary
1.1 Market Overview Exhibit 01: Executive Summary – Chart on Market Overview Exhibit 02: Executive Summary – Data Table on Market Overview Exhibit 03: Executive Summary – Chart on Global Market Characteristics Exhibit 04: Executive Summary – Chart on Market by Geography Exhibit 05: Executive Summary – Chart on Market Segmentation by Type Exhibit 06: Executive Summary – Chart on Market Segmentation by End-user Exhibit 07: Executive Summary – Chart on Incremental Growth Exhibit 08: Executive Summary – Data Table on Incremental Growth Exhibit 09: Executive Summary – Chart on Vendor Market Positioning
2 Market Landscape
2.1 Market ecosystem Exhibit 10: Parent market Exhibit 11: Market Characteristics
3 Market Sizing
3.1 Market definition Exhibit 12: Offerings of vendors included in the market definition
3.2 Market segment analysis Exhibit 13: Market segments
3.4 Market outlook: Forecast for 2021-2026 Exhibit 14: Chart on Global - Market size and forecast 2021-2026 ($ billion) Exhibit 15: Data Table on Global - Market size and forecast 2021-2026 ($ billion) Exhibit 16: Chart on Global Market: Year-over-year growth 2021-2026 (%) Exhibit 17: Data Table on Global Market: Year-over-year growth 2021-2026 (%)
4 Five Forces Analysis
4.1 Five forces summary Exhibit 18: Five forces analysis - Comparison between 2021 and 2026
4.2 Bargaining power of buyers Exhibit 19: Chart on Bargaining power of buyers – Impact of key factors 2021 and 2026
4.3 Bargaining power of suppliers Exhibit 20: Bargaining power of suppliers – Impact of key factors in 2021 and 2026
4.4 Threat of new entrants Exhibit 21: Threat of new entrants – Impact of key factors in 2021 and 2026
4.5 Threat of substitutes Exhibit 22: Threat of substitutes – Impact of key factors in 2021 and 2026
4.6 Threat of rivalry Exhibit 23: Threat of rivalry – Impact of key factors in 2021 and 2026
4.7 Market condition Exhibit 24: Chart on Market condition - Five forces 2021 and 2026
5 Market Segmentation by Type
5.1 Market segments Exhibit 25: Chart on Type - Market share 2021-2026 (%) Exhibit 26: Data Table on Type - Market share 2021-2026 (%)
5.2 Comparison by Type Exhibit 27: Chart on Comparison by Type Exhibit 28: Data Table on Comparison by Type
5.3 Ingots - Market size and forecast 2021-2026 Exhibit 29: Chart on Ingots - Market size and forecast 2021-2026 ($ billion) Exhibit 30: Data Table on Ingots - Market size and forecast 2021-2026 ($ billion) Exhibit 31: Chart on Ingots - Year-over-year growth 2021-2026 (%) Exhibit 32: Data Table on Ingots - Year-over-year growth 2021-2026 (%)
5.4 Billets - Market size and forecast 2021-2026 Exhibit 33: Chart on Billets - Market size and forecast 2021-2026 ($ billion) Exhibit 34: Data Table on Billets - Market size and forecast 2021-2026 ($ billion) Exhibit 35: Chart on Billets - Year-over-year growth 2021-2026 (%) Exhibit 36: Data Table on Billets - Year-over-year growth 2021-2026 (%)
5.5 Wire rods - Market size and forecast 2021-2026 Exhibit 37: Chart on Wire rods - Market size and forecast 2021-2026 ($ billion) Exhibit 38: Data Table on Wire rods - Market size and forecast 2021-2026 ($ billion) Exhibit 39: Chart on Wire rods - Year-over-year growth 2021-2026 (%) Exhibit 40: Data Table on Wire rods - Year-over-year growth 2021-2026 (%)
5.6 Market opportunity by Type Exhibit 41: Market opportunity by Type ($ billion)
6 Market Segmentation by End-user
6.1 Market segments Exhibit 42: Chart on End-user - Market share 2021-2026 (%) Exhibit 43: Data Table on End-user - Market share 2021-2026 (%)
6.2 Comparison by End-user Exhibit 44: Chart on Comparison by End-user Exhibit 45: Data Table on Comparison by End-user
6.3 Transportation - Market size and forecast 2021-2026 Exhibit 46: Chart on Transportation - Market size and forecast 2021-2026 ($ billion) Exhibit 47: Data Table on Transportation - Market size and forecast 2021-2026 ($ billion) Exhibit 48: Chart on Transportation - Year-over-year growth 2021-2026 (%) Exhibit 49: Data Table on Transportation - Year-over-year growth 2021-2026 (%)
6.4 Heavy machinery and industrial - Market size and forecast 2021-2026 Exhibit 50: Chart on Heavy machinery and industrial - Market size and forecast 2021-2026 ($ billion) Exhibit 51: Data Table on Heavy machinery and industrial - Market size and forecast 2021-2026 ($ billion) Exhibit 52: Chart on Heavy machinery and industrial - Year-over-year growth 2021-2026 (%) Exhibit 53: Data Table on Heavy machinery and industrial - Year-over-year growth 2021-2026 (%)
6.5 Construction - Market size and forecast 2021-2026 Exhibit 54: Chart on Construction - Market size and forecast 2021-2026 ($ billion) Exhibit 55: Data Table on Construction - Market size and forecast 2021-2026 ($ billion) Exhibit 56: Chart on Construction - Year-over-year growth 2021-2026 (%) Exhibit 57: Data Table on Construction - Year-over-year growth 2021-2026 (%)
6.6 Others - Market size and forecast 2021-2026 Exhibit 58: Chart on Others - Market size and forecast 2021-2026 ($ billion) Exhibit 59: Data Table on Others - Market size and forecast 2021-2026 ($ billion) Exhibit 60: Chart on Others - Year-over-year growth 2021-2026 (%) Exhibit 61: Data Table on Others - Year-over-year growth 2021-2026 (%)
6.7 Market opportunity by End-user Exhibit 62: Market opportunity by End-user ($ billion)
7 Customer Landscape
7.1 Customer landscape overview Exhibit 63: Analysis of price sensitivity, lifecycle, customer purchase basket, adoption rates, and purchase criteria
8 Geographic Landscape
8.1 Geographic segmentation Exhibit 64: Chart on Market share by geography 2021-2026 (%) Exhibit 65: Data Table on Market share by geography 2021-2026 (%)
8.2 Geographic comparison Exhibit 66: Chart on Geographic comparison Exhibit 67: Data Table on Geographic comparison
8.3 North America - Market size and forecast 2021-2026 Exhibit 68: Chart on North America - Market size and forecast 2021-2026 ($ billion) Exhibit 69: Data Table on North America - Market size and forecast 2021-2026 ($ billion) Exhibit 70: Chart on North America - Year-over-year growth 2021-2026 (%) Exhibit 71: Data Table on North America - Year-over-year growth 2021-2026 (%)
8.4 Europe - Market size and forecast 2021-2026 Exhibit 72: Chart on Europe - Market size and forecast 2021-2026 ($ billion) Exhibit 73: Data Table on Europe - Market size and forecast 2021-2026 ($ billion) Exhibit 74: Chart on Europe - Year-over-year growth 2021-2026 (%) Exhibit 75: Data Table on Europe - Year-over-year growth 2021-2026 (%)
8.5 APAC - Market size and forecast 2021-2026 Exhibit 76: Chart on APAC - Market size and forecast 2021-2026 ($ billion) Exhibit 77: Data Table on APAC - Market size and forecast 2021-2026 ($ billion) Exhibit 78: Chart on APAC - Year-over-year growth 2021-2026 (%) Exhibit 79: Data Table on APAC - Year-over-year growth 2021-2026 (%)
8.6 South America - Market size and forecast 2021-2026 Exhibit 80: Chart on South America - Market size and forecast 2021-2026 ($ billion) Exhibit 81: Data Table on South America - Market size and forecast 2021-2026 ($ billion) Exhibit 82: Chart on South America - Year-over-year growth 2021-2026 (%) Exhibit 83: Data Table on South America - Year-over-year growth 2021-2026 (%)
8.7 Middle East and Africa - Market size and forecast 2021-2026 Exhibit 84: Chart on Middle East and Africa - Market size and forecast 2021-2026 ($ billion) Exhibit 85: Data Table on Middle East and Africa - Market size and forecast 2021-2026 ($ billion) Exhibit 86: Chart on Middle East and Africa - Year-over-year growth 2021-2026 (%) Exhibit 87: Data Table on Middle East and Africa - Year-over-year growth 2021-2026 (%)
8.8 US - Market size and forecast 2021-2026 Exhibit 88: Chart on US - Market size and forecast 2021-2026 ($ billion) Exhibit 89: Data Table on US - Market size and forecast 2021-2026 ($ billion) Exhibit 90: Chart on US - Year-over-year growth 2021-2026 (%) Exhibit 91: Data Table on US - Year-over-year growth 2021-2026 (%)
8.9 China - Market size and forecast 2021-2026 Exhibit 92: Chart on China - Market size and forecast 2021-2026 ($ billion) Exhibit 93: Data Table on China - Market size and forecast 2021-2026 ($ billion) Exhibit 94: Chart on China - Year-over-year growth 2021-2026 (%) Exhibit 95: Data Table on China - Year-over-year growth 2021-2026 (%)
8.10 France - Market size and forecast 2021-2026 Exhibit 96: Chart on France - Market size and forecast 2021-2026 ($ billion) Exhibit 97: Data Table on France - Market size and forecast 2021-2026 ($ billion) Exhibit 98: Chart on France - Year-over-year growth 2021-2026 (%) Exhibit 99: Data Table on France - Year-over-year growth 2021-2026 (%)
8.11 Germany - Market size and forecast 2021-2026 Exhibit 100: Chart on Germany - Market size and forecast 2021-2026 ($ billion) Exhibit 101: Data Table on Germany - Market size and forecast 2021-2026 ($ billion) Exhibit 102: Chart on Germany - Year-over-year growth 2021-2026 (%) Exhibit 103: Data Table on Germany - Year-over-year growth 2021-2026 (%)
8.12 Japan - Market size and forecast 2021-2026 Exhibit 104: Chart on Japan - Market size and forecast 2021-2026 ($ billion) Exhibit 105: Data Table on Japan - Market size and forecast 2021-2026 ($ billion) Exhibit 106: Chart on Japan - Year-over-year growth 2021-2026 (%) Exhibit 107: Data Table on Japan - Year-over-year growth 2021-2026 (%)
8.13 Market opportunity by geography Exhibit 108: Market opportunity by geography ($ billion)
9 Drivers, Challenges, and Trends
9.3 Impact of drivers and challenges Exhibit 109: Impact of drivers and challenges in 2021 and 2026
10 Vendor Landscape
10.2 Vendor landscape Exhibit 110: Overview on Criticality of inputs and Factors of differentiation
10.3 Landscape disruption Exhibit 111: Overview on factors of disruption
10.4 Industry risks Exhibit 112: Impact of key risks on business
11 Vendor Analysis
11.1 Vendors covered Exhibit 113: Vendors covered
11.2 Market positioning of vendors Exhibit 114: Matrix on vendor position and classification
11.3 Alcoa Corp. Exhibit 115: Alcoa Corp. - Overview Exhibit 116: Alcoa Corp. - Business segments Exhibit 117: Alcoa Corp. - Key offerings Exhibit 118: Alcoa Corp. - Segment focus
11.4 Aleris International Inc. Exhibit 119: Aleris International Inc. - Overview Exhibit 120: Aleris International Inc. - Product / Service Exhibit 121: Aleris International Inc. - Key offerings
11.5 China Hongqiao Group Ltd. Exhibit 122: China Hongqiao Group Ltd. - Overview Exhibit 123: China Hongqiao Group Ltd. - Product / Service Exhibit 124: China Hongqiao Group Ltd. - Key offerings
11.6 Constellium SE Exhibit 125: Constellium SE - Overview Exhibit 126: Constellium SE - Business segments Exhibit 127: Constellium SE - Key news Exhibit 128: Constellium SE - Key offerings Exhibit 129: Constellium SE - Segment focus
11.7 Golden Aluminum Exhibit 130: Golden Aluminum - Overview Exhibit 131: Golden Aluminum - Product / Service Exhibit 132: Golden Aluminum - Key offerings
11.8 Kobe Steel Ltd. Exhibit 133: Kobe Steel Ltd. - Overview Exhibit 134: Kobe Steel Ltd. - Business segments Exhibit 135: Kobe Steel Ltd. - Key offerings Exhibit 136: Kobe Steel Ltd. - Segment focus
11.9 Norsk Hydro ASA Exhibit 137: Norsk Hydro ASA - Overview Exhibit 138: Norsk Hydro ASA - Business segments Exhibit 139: Norsk Hydro ASA - Key offerings Exhibit 140: Norsk Hydro ASA - Segment focus
11.10 Novelis Inc. Exhibit 141: Novelis Inc. - Overview Exhibit 142: Novelis Inc. - Business segments Exhibit 143: Novelis Inc. - Key offerings Exhibit 144: Novelis Inc. - Segment focus
11.11 Rio Tinto Ltd Exhibit 145: Rio Tinto Ltd - Overview Exhibit 146: Rio Tinto Ltd - Business segments Exhibit 147: Rio Tinto Ltd - Key news Exhibit 148: Rio Tinto Ltd - Key offerings Exhibit 149: Rio Tinto Ltd - Segment focus
11.12 United Company RUSAL Exhibit 150: United Company RUSAL - Overview Exhibit 151: United Company RUSAL - Business segments Exhibit 152: United Company RUSAL - Key offerings Exhibit 153: United Company RUSAL - Segment focus
12 Appendix
12.2 Inclusions and exclusions checklist Exhibit 154: Inclusions checklist Exhibit 155: Exclusions checklist
12.3 Currency conversion rates for US$ Exhibit 156: Currency conversion rates for US$
12.4 Research methodology Exhibit 157: Research methodology Exhibit 158: Validation techniques employed for market sizing Exhibit 159: Information sources
12.5 List of abbreviations Exhibit 160: List of abbreviations
About Us Technavio is a leading global technology research and advisory company. Their research and analysis focuses on emerging market trends and provides actionable insights to help businesses identify market opportunities and develop effective strategies to optimize their market positions.
With over 500 specialized analysts, Technavio's report library consists of more than 17,000 reports and counting, covering 800 technologies, spanning across 50 countries. Their client base consists of enterprises of all sizes, including more than 100 Fortune 500 companies. This growing client base relies on Technavio's comprehensive coverage, extensive research, and actionable market insights to identify opportunities in existing and potential markets and assess their competitive positions within changing market scenarios.
Contact Technavio ResearchJesse MaidaMedia & Marketing ExecutiveUS: +1 844 364 1100UK: +44 203 893 3200Email: Website:
SOURCE Technavio