(MENAFN- PR Newswire)
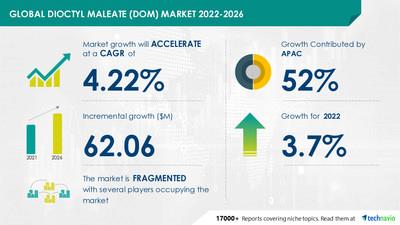
NEW YORK, Sept. 23, 2022 /PRNewswire/ -- The ' Dioctyl Maleate (DOM) Market by Application and Geography - Forecast and Analysis 2022-2026 ' report has been added to Technavio's offering. According to the report, the market will observe an incremental growth of USD 62.06 million, accelerating at a CAGR of 4.22% during the forecast period. The report considers various factors such as the consumer base, adoption rate, average selling price, revenue generated by vendors, and various other factors to estimate the market size. Download Sample PDF Report Here to get an idea of the overall scope of the full report.
Continue Reading
Technavio has announced its latest market research report titled Global Dioctyl Maleate (DOM) Market 2022-2026
The high usage of DOM in the cosmetics and personal care industry will offer immense growth opportunities. To leverage the current opportunities, market vendors must strengthen their foothold in the fast-growing segments while maintaining their positions in the slow-growing segments.
The market is fragmented in nature due to the presence of numerous regional and international vendors. Vendors compete on price and quality. Intense competition and declining profit margins are some significant risk factors for vendors operating in the market. Technological changes, packaging, and transportation are other significant risk factors. Therefore, vendors distinguish their product offerings through clear and unique value propositions to stay ahead of the competition.
The major players in the market are keenly focusing on M&As to expand their line of business and shield themselves from the threat of rivalry. The medium and small-scale vendors are developing innovative capabilities, while the key vendors continue to have a strong foothold in the market. The competitive environment of the market is expected to intensify further during the forecast period, owing to an increase in R&D activities for technology and product development.
The report identifies Avantor Inc., Banner Chemicals Ltd, Biesterfeld AG, Celanese Corp., ChemCeed LLC, Covalent Chemical LLC, ESIM Chemicals GmbH, Hallstar Innovations Corp., Hangzhou Qianyang Technology Co. Ltd., Henan GP Chemicals Co. Ltd., Merck KGaA, Nayakem Organics Pvt. Ltd., Neuchem, Parchem Fine and Specialty Chemicals, Polynt Spa, Prakash Chemicals International Pvt. Ltd., Tokyo Chemical Industry Co. Ltd., and YUANLI CHEMICAL GROUP Co. Ltd. as some of the major market participants. Request Sample Report Here
Dioctyl Maleate (DOM) Market 2022-2026: Segmentation
- Application
- Surfactant
- Adhesives
- Coatings
- Others
The market growth in the surfactant segment will be significant over the forecast period. The segment is driven by the increasing use of surfactants as detergents, wetting agents, emulsifiers, foaming agents, and dispersants. Also, the increasing applications of surfactants in personal care, institutional cleaning, and food processing industries is contributing to the growth of the segment.
- Geography
- APAC
- North America
- Europe
- Middle East and Africa
- South America
52% of the market growth will originate from APAC during the forecast period. The growing demand for paints and coatings and adhesive applications in the building and construction industry will drive the growth of the regional market.
The report also covers the following areas:
- Dioctyl Maleate (DOM) Market Size
- Dioctyl Maleate (DOM) Market Trends
- Dioctyl Maleate (DOM) Market Industry Analysis
Dioctyl Maleate (DOM) Market 2022-2026: Key Highlights - CAGR of the market during the forecast period 2022-2026
- Detailed information on factors that will assist dioctyl maleate (DOM) market growth during the next five years
- Estimation of the dioctyl maleate (DOM) market size and its contribution to the parent market
- Predictions on upcoming trends and changes in consumer behavior
- The growth of the dioctyl maleate (DOM) market
- Analysis of the market's competitive landscape and detailed information on vendors
- Comprehensive details of factors that will challenge the growth of dioctyl maleate (DOM) market vendors
Related Reports: - Acetic Acid Market Research by Application and Geography - Forecast and Analysis 2022-2026
- Silica Gel Market by Product, End-user, and Geography - Forecast and Analysis 2022-2026
| Dioctyl Maleate (DOM) Market Scope |
| Report Coverage | Details |
| Page number | 120 |
| Base year | 2021 |
| Forecast period | 2022-2026 |
| Growth momentum & CAGR | Accelerate at a CAGR of 4.22% |
| Market growth 2022-2026 | USD 62.06 million |
| Market structure | Fragmented |
| YoY growth (%) | 3.7 |
| Regional analysis | APAC, North America, Europe, Middle East and Africa,and South America |
| Performing market contribution | APAC at 52% |
| Key consumer countries | US, Canada, China, India, Germany, and Italy |
| Competitive landscape | Leading companies, competitive strategies, consumerengagement scope |
| Companies profiled | Avantor Inc., Banner Chemicals Ltd, Biesterfeld AGCelanese Corp., ChemCeed LLC, Covalent ChemicalLLC, ESIM Chemicals GmbH, Hallstar InnovationsCorp., Hangzhou Qianyang Technology Co. Ltd., HenanGP Chemicals Co. Ltd., Merck KGaA, NayakemOrganics Pvt. Ltd., Neuchem, Parchem Fine andSpecialty Chemicals, Polynt Spa, Prakash ChemicalsInternational Pvt. Ltd., Tokyo Chemical Industry CoLtd., and YUANLI CHEMICAL GROUP Co. Ltd. |
| Market Dynamics | Parent market analysis, Market growth inducers andobstacles, Fast-growing and slow-growing segmentanalysis, COVID-19 impact and future consumerdynamics, and market condition analysis for theforecast period. |
| Customization purview | If our report has not included the data that you arelooking for, you can reach out to our analysts and getsegments customized. |
Table of contents: 1 Executive Summary
- 1.1 Market overview
- Exhibit 01: Executive Summary – Chart on Market Overview
- Exhibit 02: Executive Summary – Data Table on Market Overview
- Exhibit 03: Executive Summary – Chart on Global Market Characteristics
- Exhibit 04: Executive Summary – Chart on Market by Geography
- Exhibit 05: Executive Summary – Chart on Market Segmentation by Application
- Exhibit 06: Executive Summary – Chart on Incremental Growth
- Exhibit 07: Executive Summary – Data Table on Incremental Growth
- Exhibit 08: Executive Summary – Chart on Vendor Market Positioning
2 Market Landscape
- 2.1 Market ecosystem
- Exhibit 09: Parent market
- Exhibit 10: Market Characteristics
3 Market Sizing
- 3.1 Market definition
- Exhibit 11: Offerings of vendors included in the market definition
- 3.2 Market segment analysis
- Exhibit 12: Market segments
- 3.4 Market outlook: Forecast for 2021-2026
- Exhibit 13: Chart on Global - Market size and forecast 2021-2026 ($ million)
- Exhibit 14: Data Table on Global - Market size and forecast 2021-2026 ($ million)
- Exhibit 15: Chart on Global Market: Year-over-year growth 2021-2026 (%)
- Exhibit 16: Data Table on Global Market: Year-over-year growth 2021-2026 (%)
4 Five Forces Analysis
- 4.1 Five forces summary
- Exhibit 17: Five forces analysis - Comparison between 2021 and 2026
- 4.2 Bargaining power of buyers
- Exhibit 18: Chart on Bargaining power of buyers – Impact of key factors 2021 and 2026
- 4.3 Bargaining power of suppliers
- Exhibit 19: Bargaining power of suppliers – Impact of key factors in 2021 and 2026
- 4.4 Threat of new entrants
- Exhibit 20: Threat of new entrants – Impact of key factors in 2021 and 2026
- 4.5 Threat of substitutes
- Exhibit 21: Threat of substitutes – Impact of key factors in 2021 and 2026
- 4.6 Threat of rivalry
- Exhibit 22: Threat of rivalry – Impact of key factors in 2021 and 2026
- 4.7 Market condition
- Exhibit 23: Chart on Market condition - Five forces 2021 and 2026
5 Market Segmentation by Application
- 5.1 Market segments
- Exhibit 24: Chart on Application - Market share 2021-2026 (%)
- Exhibit 25: Data Table on Application - Market share 2021-2026 (%)
- 5.2 Comparison by Application
- Exhibit 26: Chart on Comparison by Application
- Exhibit 27: Data Table on Comparison by Application
- 5.3 Surfactant - Market size and forecast 2021-2026
- Exhibit 28: Chart on Surfactant - Market size and forecast 2021-2026 ($ million)
- Exhibit 29: Data Table on Surfactant - Market size and forecast 2021-2026 ($ million)
- Exhibit 30: Chart on Surfactant - Year-over-year growth 2021-2026 (%)
- Exhibit 31: Data Table on Surfactant - Year-over-year growth 2021-2026 (%)
- 5.4 Adhesives - Market size and forecast 2021-2026
- Exhibit 32: Chart on Adhesives - Market size and forecast 2021-2026 ($ million)
- Exhibit 33: Data Table on Adhesives - Market size and forecast 2021-2026 ($ million)
- Exhibit 34: Chart on Adhesives - Year-over-year growth 2021-2026 (%)
- Exhibit 35: Data Table on Adhesives - Year-over-year growth 2021-2026 (%)
- 5.5 Coatings - Market size and forecast 2021-2026
- Exhibit 36: Chart on Coatings - Market size and forecast 2021-2026 ($ million)
- Exhibit 37: Data Table on Coatings - Market size and forecast 2021-2026 ($ million)
- Exhibit 38: Chart on Coatings - Year-over-year growth 2021-2026 (%)
- Exhibit 39: Data Table on Coatings - Year-over-year growth 2021-2026 (%)
- 5.6 Others - Market size and forecast 2021-2026
- Exhibit 40: Chart on Others - Market size and forecast 2021-2026 ($ million)
- Exhibit 41: Data Table on Others - Market size and forecast 2021-2026 ($ million)
- Exhibit 42: Chart on Others - Year-over-year growth 2021-2026 (%)
- Exhibit 43: Data Table on Others - Year-over-year growth 2021-2026 (%)
- 5.7 Market opportunity by Application
- Exhibit 44: Market opportunity by Application ($ million)
6 Customer Landscape
- 6.1 Customer landscape overview
- Exhibit 45: Analysis of price sensitivity, lifecycle, customer purchase basket, adoption rates, and purchase criteria
7 Geographic Landscape
- 7.1 Geographic segmentation
- Exhibit 46: Chart on Market share by geography 2021-2026 (%)
- Exhibit 47: Data Table on Market share by geography 2021-2026 (%)
- 7.2 Geographic comparison
- Exhibit 48: Chart on Geographic comparison
- Exhibit 49: Data Table on Geographic comparison
- 7.3 APAC - Market size and forecast 2021-2026
- Exhibit 50: Chart on APAC - Market size and forecast 2021-2026 ($ million)
- Exhibit 51: Data Table on APAC - Market size and forecast 2021-2026 ($ million)
- Exhibit 52: Chart on APAC - Year-over-year growth 2021-2026 (%)
- Exhibit 53: Data Table on APAC - Year-over-year growth 2021-2026 (%)
- 7.4 North America - Market size and forecast 2021-2026
- Exhibit 54: Chart on North America - Market size and forecast 2021-2026 ($ million)
- Exhibit 55: Data Table on North America - Market size and forecast 2021-2026 ($ million)
- Exhibit 56: Chart on North America - Year-over-year growth 2021-2026 (%)
- Exhibit 57: Data Table on North America - Year-over-year growth 2021-2026 (%)
- 7.5 Europe - Market size and forecast 2021-2026
- Exhibit 58: Chart on Europe - Market size and forecast 2021-2026 ($ million)
- Exhibit 59: Data Table on Europe - Market size and forecast 2021-2026 ($ million)
- Exhibit 60: Chart on Europe - Year-over-year growth 2021-2026 (%)
- Exhibit 61: Data Table on Europe - Year-over-year growth 2021-2026 (%)
- 7.6 Middle East and Africa - Market size and forecast 2021-2026
- Exhibit 62: Chart on Middle East and Africa - Market size and forecast 2021-2026 ($ million)
- Exhibit 63: Data Table on Middle East and Africa - Market size and forecast 2021-2026 ($ million)
- Exhibit 64: Chart on Middle East and Africa - Year-over-year growth 2021-2026 (%)
- Exhibit 65: Data Table on Middle East and Africa - Year-over-year growth 2021-2026 (%)
- 7.7 South America - Market size and forecast 2021-2026
- Exhibit 66: Chart on South America - Market size and forecast 2021-2026 ($ million)
- Exhibit 67: Data Table on South America - Market size and forecast 2021-2026 ($ million)
- Exhibit 68: Chart on South America - Year-over-year growth 2021-2026 (%)
- Exhibit 69: Data Table on South America - Year-over-year growth 2021-2026 (%)
- 7.8 US - Market size and forecast 2021-2026
- Exhibit 70: Chart on US - Market size and forecast 2021-2026 ($ million)
- Exhibit 71: Data Table on US - Market size and forecast 2021-2026 ($ million)
- Exhibit 72: Chart on US - Year-over-year growth 2021-2026 (%)
- Exhibit 73: Data Table on US - Year-over-year growth 2021-2026 (%)
- 7.9 China - Market size and forecast 2021-2026
- Exhibit 74: Chart on China - Market size and forecast 2021-2026 ($ million)
- Exhibit 75: Data Table on China - Market size and forecast 2021-2026 ($ million)
- Exhibit 76: Chart on China - Year-over-year growth 2021-2026 (%)
- Exhibit 77: Data Table on China - Year-over-year growth 2021-2026 (%)
- 7.10 India - Market size and forecast 2021-2026
- Exhibit 78: Chart on India - Market size and forecast 2021-2026 ($ million)
- Exhibit 79: Data Table on India - Market size and forecast 2021-2026 ($ million)
- Exhibit 80: Chart on India - Year-over-year growth 2021-2026 (%)
- Exhibit 81: Data Table on India - Year-over-year growth 2021-2026 (%)
- 7.11 Germany - Market size and forecast 2021-2026
- Exhibit 82: Chart on Germany - Market size and forecast 2021-2026 ($ million)
- Exhibit 83: Data Table on Germany - Market size and forecast 2021-2026 ($ million)
- Exhibit 84: Chart on Germany - Year-over-year growth 2021-2026 (%)
- Exhibit 85: Data Table on Germany - Year-over-year growth 2021-2026 (%)
- 7.12 Italy - Market size and forecast 2021-2026
- Exhibit 86: Chart on Italy - Market size and forecast 2021-2026 ($ million)
- Exhibit 87: Data Table on Italy - Market size and forecast 2021-2026 ($ million)
- Exhibit 88: Chart on Italy - Year-over-year growth 2021-2026 (%)
- Exhibit 89: Data Table on Italy - Year-over-year growth 2021-2026 (%)
- 7.13 Canada - Market size and forecast 2021-2026
- Exhibit 90: Chart on Canada - Market size and forecast 2021-2026 ($ million)
- Exhibit 91: Data Table on Canada - Market size and forecast 2021-2026 ($ million)
- Exhibit 92: Chart on Canada - Year-over-year growth 2021-2026 (%)
- Exhibit 93: Data Table on Canada - Year-over-year growth 2021-2026 (%)
- 7.14 Market opportunity by geography
- Exhibit 94: Market opportunity by geography ($ million)
8 Drivers, Challenges, and Trends
- 8.3 Impact of drivers and challenges
- Exhibit 95: Impact of drivers and challenges in 2021 and 2026
9 Vendor Landscape
- 9.2 Vendor landscape
- Exhibit 96: Overview on Criticality of inputs and Factors of differentiation
- 9.3 Landscape disruption
- Exhibit 97: Overview on factors of disruption
- 9.4 Industry risks
- Exhibit 98: Impact of key risks on business
10 Vendor Analysis
- 10.1 Vendors covered
- Exhibit 99: Vendors covered
- 10.2 Market positioning of vendors
- Exhibit 100: Matrix on vendor position and classification
- 10.3 Avantor Inc.
- Exhibit 101: Avantor Inc. - Overview
- Exhibit 102: Avantor Inc. - Business segments
- Exhibit 103: Avantor Inc. - Key news
- Exhibit 104: Avantor Inc. - Key offerings
- Exhibit 105: Avantor Inc. - Segment focus
- 10.4 Biesterfeld AG
- Exhibit 106: Biesterfeld AG - Overview
- Exhibit 107: Biesterfeld AG - Product / Service
- Exhibit 108: Biesterfeld AG - Key offerings
- 10.5 Celanese Corp.
- Exhibit 109: Celanese Corp. - Overview
- Exhibit 110: Celanese Corp. - Business segments
- Exhibit 111: Celanese Corp. - Key offerings
- Exhibit 112: Celanese Corp. - Segment focus
- 10.6 ESIM Chemicals GmbH
- Exhibit 113: ESIM Chemicals GmbH - Overview
- Exhibit 114: ESIM Chemicals GmbH - Product / Service
- Exhibit 115: ESIM Chemicals GmbH - Key offerings
- 10.7 Hallstar Innovations Corp.
- Exhibit 116: Hallstar Innovations Corp. - Overview
- Exhibit 117: Hallstar Innovations Corp. - Product / Service
- Exhibit 118: Hallstar Innovations Corp. - Key offerings
- 10.8 Hangzhou Qianyang Technology Co. Ltd.
- Exhibit 119: Hangzhou Qianyang Technology Co. Ltd. - Overview
- Exhibit 120: Hangzhou Qianyang Technology Co. Ltd. - Product / Service
- Exhibit 121: Hangzhou Qianyang Technology Co. Ltd. - Key offerings
- 10.9 Merck KGaA
- Exhibit 122: Merck KGaA - Overview
- Exhibit 123: Merck KGaA - Business segments
- Exhibit 124: Merck KGaA - Key news
- Exhibit 125: Merck KGaA - Key offerings
- Exhibit 126: Merck KGaA - Segment focus
- 10.10 Nayakem Organics Pvt. Ltd.
- Exhibit 127: Nayakem Organics Pvt. Ltd. - Overview
- Exhibit 128: Nayakem Organics Pvt. Ltd. - Product / Service
- Exhibit 129: Nayakem Organics Pvt. Ltd. - Key offerings
- 10.11 Polynt Spa
- Exhibit 130: Polynt Spa - Overview
- Exhibit 131: Polynt Spa - Product / Service
- Exhibit 132: Polynt Spa - Key offerings
- 10.12 Tokyo Chemical Industry Co. Ltd.
- Exhibit 133: Tokyo Chemical Industry Co. Ltd. - Overview
- Exhibit 134: Tokyo Chemical Industry Co. Ltd. - Product / Service
- Exhibit 135: Tokyo Chemical Industry Co. Ltd. - Key offerings
11 Appendix
- 11.2 Inclusions and exclusions checklist
- Exhibit 136: Inclusions checklist
- Exhibit 137: Exclusions checklist
- 11.3 Currency conversion rates for US$
- Exhibit 138: Currency conversion rates for US$
- 11.4 Research methodology
- Exhibit 139: Research methodology
- Exhibit 140: Validation techniques employed for market sizing
- Exhibit 141: Information sources
- 11.5 List of abbreviations
- Exhibit 142: List of abbreviations
About Us Technavio is a leading global technology research and advisory company. Their research and analysis focus on emerging market trends and provides actionable insights to help businesses identify market opportunities and develop effective strategies to optimize their market positions. With over 500 specialized analysts, Technavio's report library consists of more than 17,000 reports and counting, covering 800 technologies, spanning across 50 countries. Their client base consists of enterprises of all sizes, including more than 100 Fortune 500 companies. This growing client base relies on Technavio's comprehensive coverage, extensive research, and actionable market insights to identify opportunities in existing and potential markets and assess their competitive positions within changing market scenarios.
Contact Technavio ResearchJesse MaidaMedia & Marketing ExecutiveUS: +1 844 364 1100UK: +44 203 893 3200Email: [email protected] Website:
SOURCE Technavio
MENAFN23092022003732001241ID1104916724
Legal Disclaimer:
MENAFN provides the information “as is” without warranty of any kind. We do not accept any responsibility or liability for the accuracy, content, images, videos, licenses, completeness, legality, or reliability of the information contained in this article. If you have any complaints or copyright issues related to this article, kindly contact the provider above.