(MENAFN- Asia Times)
NEW YORK – China has become the dominant source of demand for Asian manufactures and the leading supplier of goods to the United States and Western Europe during the past two years, reshaping global trade patterns.
The sheer increase in China's export volume is impressive, but just as important is the composition of trade. Asia has become tightly integrated as a Sinocentric trade zone, and the Western industrial nations have become more dependent on Chinese goods.
Some American strategists worry about China's growing power in Asia. China's enormous gains in Asian trade during the past two years at the expense of the US and Japan make that a moot point.
Elbridge Colby, a former Defense Department official who advocates a“strategy of denial” against China, tweeted on December 22:“Global peace isn't our goal. Preserving Americans' security, freedom and prosperity is. Not compatible with China dominating Asia, the world's largest market area.”
In economic terms, that concern is two years late and a trillion dollars short.
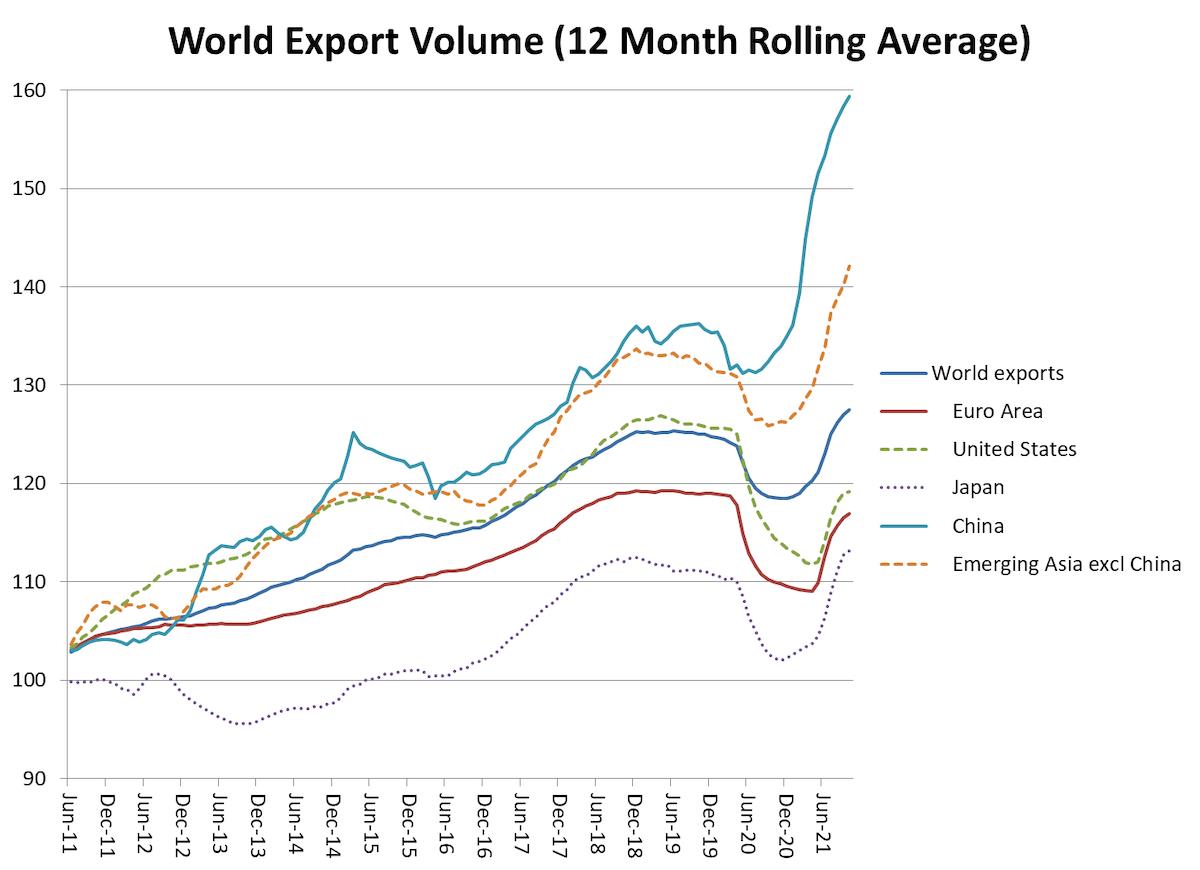
The Netherlands Central Planning Bureau calculates the physical volume of world trade, and its data shows a nearly 30% increase in China's exports since December 2019. The US, Europe and Japan show declines or stagnation.
We do not have physical volume data at country level, but the dollar volumes show a sea-change in trade patterns – using data from China's statistical office, seasonally-adjusted with the TRAMO algorithm on the EVIEWS econometrics platform.
Notably, China's imports from the rest of Asia doubled in dollar terms from December 2019 to November 2021, from about US$18 to $36 billion a month.
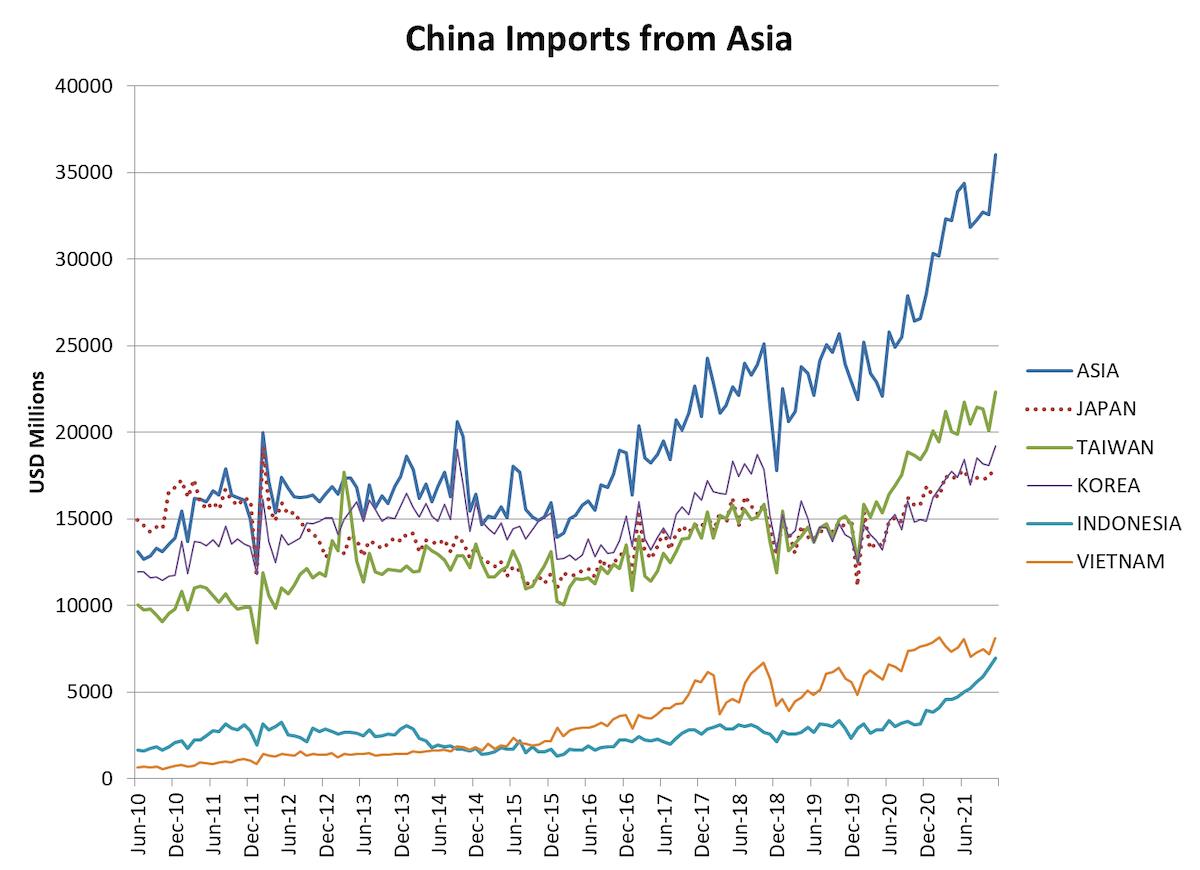
Major increases in China's imports were registered from every country except Vietnam, which exported about 36% of its GDP to China before the pandemic. Taiwan showed the biggest increase over the period, at roughly 50%.
Electronic components for China's assembly industry probably accounted for a large part of the increase and supported China's rising exports to the US and Europe.
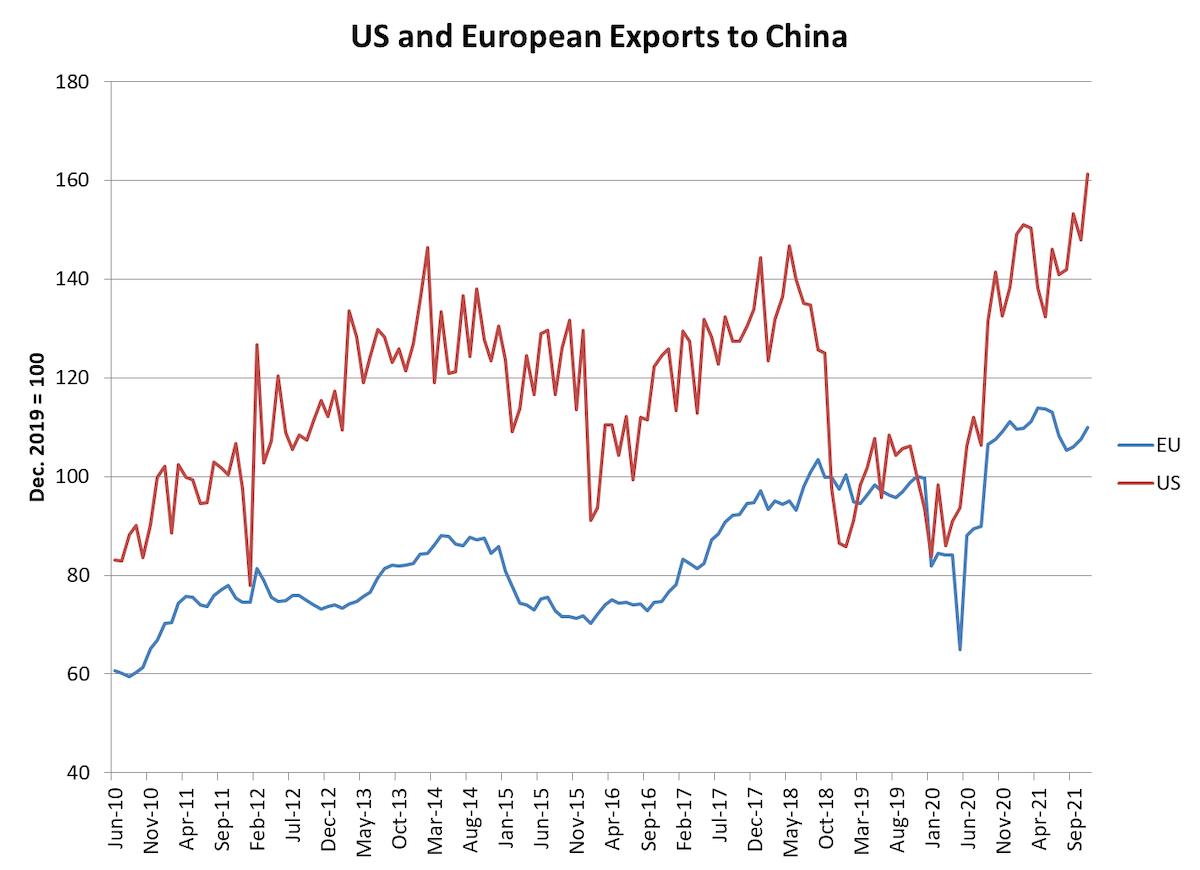
US exports to China, by contrast, haven't risen much since mid-2010, while Europe's exports to China have risen modestly.
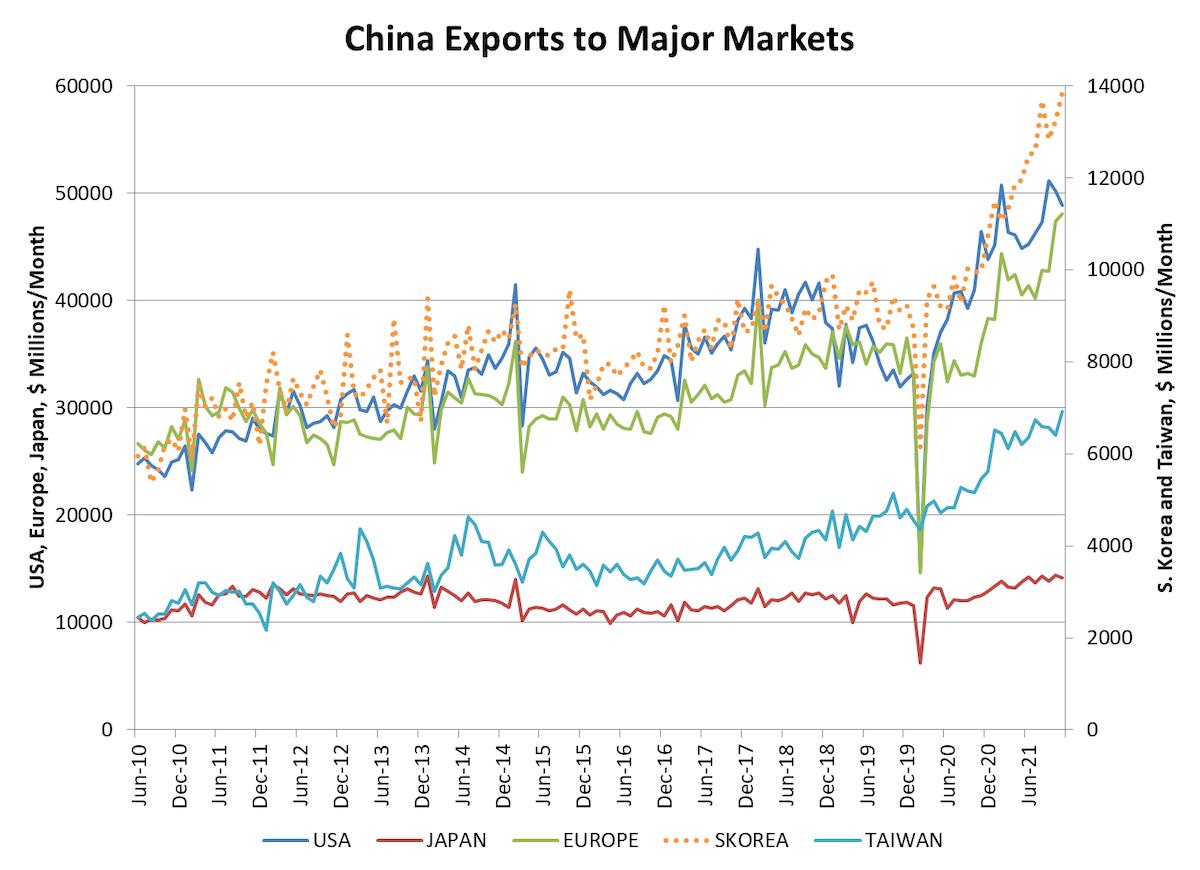
Taiwan's annual $270 billion of exports to China now amount to 36% of its GDP, an exceptionally close level of economic integration. South Korea's exports to China amount to 14% of GDP, a smaller but still significant proportion, and are growing fast – as are China's exports to South Korea, up about 50% since December 2019.
China's exports to the US and Western Europe, meanwhile, rose by nearly half between December 2019 and November 2021. China's $600 billion of annual exports to the US amounts to 26% of America's $2.3 trillion in US manufacturing GDP.
Follow David P Goldman on Twitter at @davidpgoldman
MENAFN23122021000159011032ID1103434876
Legal Disclaimer:
MENAFN provides the information “as is” without warranty of any kind. We do not accept any responsibility or liability for the accuracy, content, images, videos, licenses, completeness, legality, or reliability of the information contained in this article. If you have any complaints or copyright issues related to this article, kindly contact the provider above.