(MENAFN- DailyFX)
GOLD PRICE OUTLOOK: XAU/USD PERKING UP AS REAL YIELDS WILT
- Gold bulls push the precious metal to its highest level in eight-weeks
- Gold outlook has improved largely thanks to a pullback in real yields
- XAU/USD price action now challenges a key technical resistance zone
- Visit our Education Center to sharpen your technical analysis skills!
Advertisement
Gold prices have been ripping higher recently since putting in a potential double-bottom pattern around $1,680/oz. In fact, the precious metal now trades at an eight-week high following a 7% climb off its 30 March swing low. A pullback in the US Dollar and real yields seem to be benefiting gold outlook and motivating the rebound being staged by XAU/USD price action.
GOLD PRICE CHART WITH US TEN-YEAR REAL YIELD OVERLAID: DAILY TIME FRAME (02 JUNE 2020 TO 21 APRIL 2021)
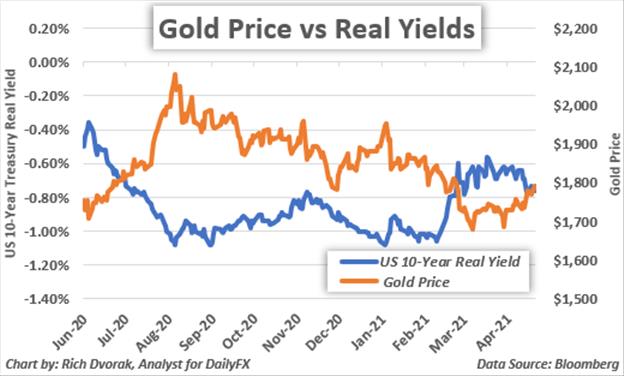
As shown on the chart above, the price of gold tends to mirror (i.e. move in the opposite direction) of real yields. Due to this strong inverse relationship, the broader direction of real yields continues to stand out as one of the dominant fundamental catalysts weighing on gold prices. Correspondingly, if real yields struggle to regain upward momentum, there could be potential for XAU/USD to extend its rebound.
GOLD PRICE CHART: WEEKLY TIME FRAME (01 JULY 2019 TO 21 APRIL 2021)

Chart by @RichDvorakFX created using TradingView
Shifting focus to a technical perspective, how the precious metal finishes the week could prove quite telling of where gold prices trend next. A close above the 20-week simple moving average , which just so happens to underpin a big area of technical confluence around the $1,790-price level, might be followed by continuation higher and a bullish MACD crossover . The 38.2% Fibonacci retracement of its August 2020 to March 2021 trading range likely comes into focus under this scenario.

Surmounting this technical barrier has potential to motivate a larger rebound toward the upper descending trendline of gold's eight-month long bull flag pattern . On the other hand, if gold bulls fail to maintain their upper hand and this technical barrier near the psychologically-significant $1,800-handle is rejected, the precious metal might recoil back toward its bottom Bollinger Band and year-to-date lows.
-- Written by Rich Dvorak , Analyst for DailyFX.com
Connect with @RichDvorakFX on Twitter for real-time market insight
MENAFN21042021000076011015ID1101960776
Legal Disclaimer:
MENAFN provides the information “as is” without warranty of any kind. We do not accept any responsibility or liability for the accuracy, content, images, videos, licenses, completeness, legality, or reliability of the information contained in this article. If you have any complaints or copyright issues related to this article, kindly contact the provider above.