


403
Sorry!!
Error! We're sorry, but the page you were looking for doesn't exist.

Gold Price Forecast: Short-term Double Bottom Emerges - Levels for XAU/USD
(MENAFN- DailyFX) Advertisement Gold Price Outlook:
Gold Prices, Gold Volatility Askew

IG CLIENT SENTIMENT INDEX: GOLD PRICE FORECAST (April 15, 2021) (CHART 4)
- Following their rebound from critical trend support at the end of March, gold prices have now broken through multi-week consolidation resistance, suggesting that a double bottom may be in place.
- Although the downtrend since the August 2020 high remains in place, the rebound gives long-term bulls hope that by holding the pandemic uptrend, gold prices are defining their nine-month downturn as a bull flag.
- According to the IG Client Sentiment Index , gold prices have a bullish bias in the near-term.
Gold prices have been performing well in April, hitting a fresh monthly high earlier in today's session. Historically speaking, gold prices may be enjoying the seasonal tailwinds that are hampering the US Dollar (with gains averaging +2.39% over the past 5-years and +1.4% over the past 10-years). Building on the breakout from their intrayearly downtrend, gold has also pivoted higher through multi-week consolidation resistance, suggesting that a double bottom may be in place.
Gold Prices, Gold Volatility Askew
Historically, gold prices have a relationship with volatility unlike other asset classes. While other asset classes like bonds and stocks don't like increased volatility signaling greater uncertainty around cash flows, dividends, coupon payments, etc. gold tends to benefit during periods of higher volatility.
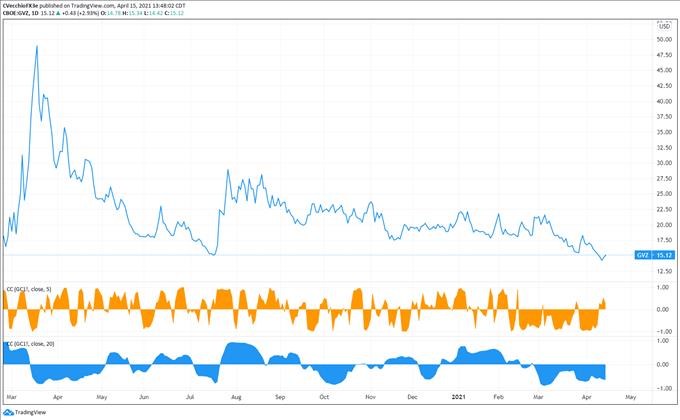
GVZ (Gold Volatility) Technical Analysis: Daily Price Chart (February 2020 to April 2021) (Chart 1)Gold volatility (as measured by the Cboe's gold volatility ETF, GVZ, which tracks the 1-month implied volatility of gold as derived from the GLD option chain) is trading at 15.12, far below the yearly high set during the first week of February at 24.03. Declines in gold volatility throughout April have not tracked with the gains in gold prices, an unusual occurrence.
In fact, since early-March, gold prices and gold volatility have endured a mostly negative relationship according to both the 5- and 20-day correlations. The 5-day correlation between GVZ and gold prices is +0.28 while the 20-day correlation is -0.64. One week ago, on March 24, the 5-day correlation was -0.86 and the 20-day correlation was -0.56.
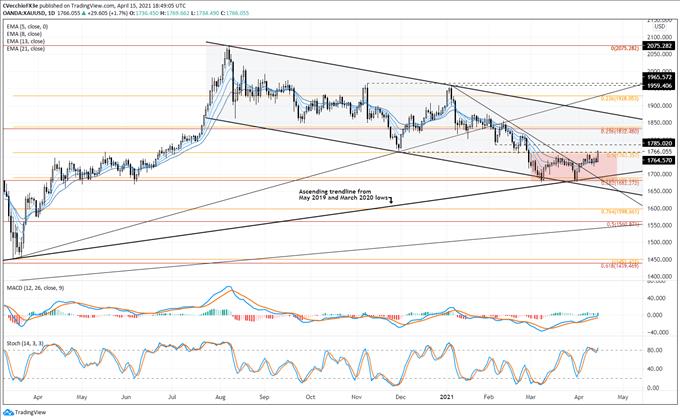
Gold Price Rate Technical Analysis: Daily Chart (March 2020 to April 2021) (Chart 2)At the end of March it was observed that 'more constructive price action is likely required before traders can have more confidence in the counter-trend gold price rebound. Today, that sign of confidence may have emerged with a bullish breakout above a trifecta of technical levels: the 50% Fibonacci retracement of the 2020 low/high range at 1763.36; the December 2020 low; and the December 2020 high.
In breaking through this area, gold prices may have established a short-term double bottom, setting out a path to gain further within the confines of the descending parallel channel from the August 2020 (all-time high) and January 2021 highs. A simple doubling of the recent consolidation (1759.95-1677.36) above resistance suggests that gold prices may heading towards 1842.54 in the near-term which would see bullion back to another cluster of Fibonacci retracements that proved consequential in early-2021.
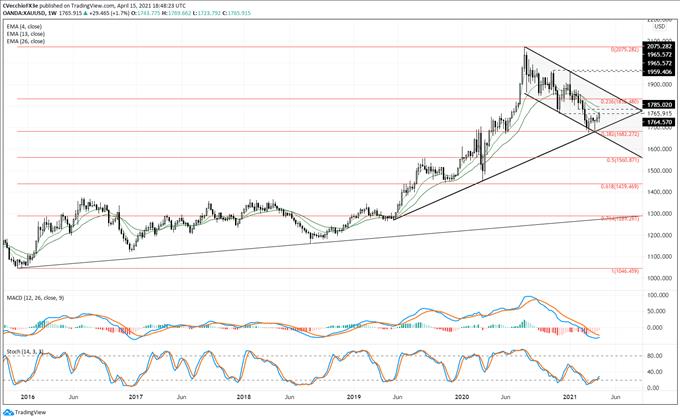
Gold Price Technical Analysis: Weekly Chart (October 2015 to April 2021) (Chart 3)It's been previously noted that 'reconsideration was trigged with the drop below 1763.36. Gold prices are currently viewed with a neutral bias on the weekly timeframe, but the technical outlook could soon erode from neutral to bearish below 1682.27, the 38.2% Fibonacci retracement of the 2015 low/2020 high range. While the broader confines of the descending parallel channel that's been forming relative to the August 2020 (all-time) high remain in place, now back above 1763.36, the rebound gives long-term bulls hope that by holding the pandemic uptrend, gold prices are defining their nine-month downturn as a bull flag.
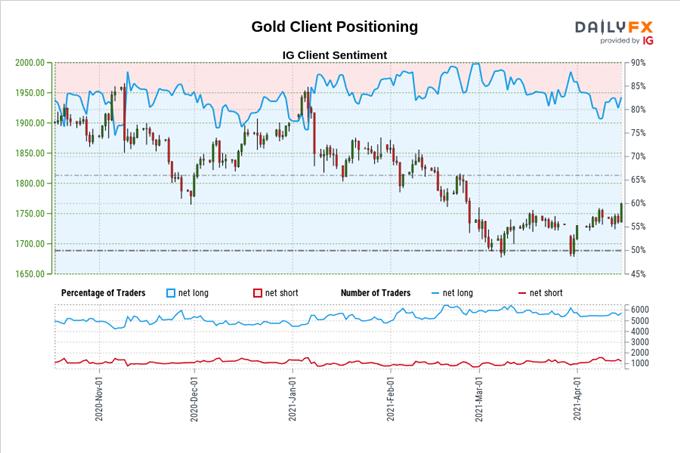
IG CLIENT SENTIMENT INDEX: GOLD PRICE FORECAST (April 15, 2021) (CHART 4)
Gold: Retail trader data shows 80.64% of traders are net-long with the ratio of traders long to short at 4.17 to 1. The number of traders net-long is 0.38% lower than yesterday and 1.68% higher from last week, while the number of traders net-short is 0.76% higher than yesterday and 6.91% lower from last week.
We typically take a contrarian view to crowd sentiment, and the fact traders are net-long suggests Gold prices may continue to fall.
Positioning is less net-long than yesterday but more net-long from last week. The combination of current sentiment and recent changes gives us a further mixed Gold trading bias.
--- Written by Christopher Vecchio, CFA, Senior Currency Strategist

Legal Disclaimer:
MENAFN provides the
information “as is” without warranty of any kind. We do not accept
any responsibility or liability for the accuracy, content, images,
videos, licenses, completeness, legality, or reliability of the information
contained in this article. If you have any complaints or copyright
issues related to this article, kindly contact the provider above.
Most popular stories
Market Research

More Story


Comments
No comment