(MENAFN- Newsfile Corp) Updated independently verified Indicated Mineral Resource again increases the Kamoa Copper Discovery to 256 million tonnes grading 4.15% copper, at a 3% cut-off
Combined Kamoa-Kakula Project Indicated Mineral Resource now stands at 423 million tonnes grading 4.68% copper, at a 3% cut-off
Combined Kamoa-Kakula Project Indicated Mineral Resource now stands at 1.4 billion tonnes grading 2.7% copper, at a 1% cut-off
Initial Indicated Mineral Resource estimate for the Kamoa North Bonanza Zone includes 1.5 million tonnes grading 10.7% copper, at a 5% cut-off
Drilling continues to target additional resources in the vicinity of the ultra-high-grade Bonanza Zone and the Far North Zone
Kolwezi, Democratic Republic of Congo--(Newsfile Corp. - February 5, 2020) - Robert Friedland and Yufeng "Miles" Sun, Co-Chairs of Ivanhoe Mines (TSX: IVN) (OTCQX: IVPAF), announced today the completion of an independently-verified, updated Mineral Resource estimate for the Kamoa-Kakula Copper Project in the Democratic Republic of Congo (DRC).
The Kamoa Deposit ─ originally discovered by Ivanhoe Mines' geologists in 2008 ─ is one of two very large, near-surface, flat-lying, stratiform copper deposits discovered to date on the 400-square-kilometre Kamoa-Kakula mining licence. The other major deposit ─ Kakula ─ is being fast-tracked to commercial production, with the initial 3.8 million-tonne-per-annum mining operation scheduled to produce first concentrate in Q3 2021.
As shown in Figure 1 below, the Kamoa Deposit includes the recently-discovered, ultra-high-grade Kamoa North Bonanza Zone and the Far North Zone.
The new Mineral Resource estimate is the culmination of an infill drilling program designed to better define higher-grade copper zones within the existing Kamoa Deposit.
At a 1% cut-off, Kamoa's Indicated Mineral Resources now total 760 million tonnes grading 2.73% copper, containing 45.8 billion pounds of copper. At the same 1% cut-off, Kamoa's Inferred Mineral Resources now total 235 million tonnes grading 1.70% copper, containing 8.8 billion pounds of copper.
At a 3% cut-off, the new Mineral Resource estimate boosts the Kamoa Deposit's Indicated Mineral Resource tonnages by 15% and contained copper by 15.5%, to a total of 256.8 million tonnes at a grade of 4.15% copper. At the same 3% cut-off, Kamoa's Inferred Mineral Resources now total 13 million tonnes at a grade of 3.51% copper.
"The delineation of Indicated Mineral Resources at the North Bonanza Zone and the Far North Zone continues the long history of exploration success at Kamoa-Kakula," said George Gilchrist, Ivanhoe Mines' Vice President, Resources. "We see excellent opportunity to add further shallow, higher-grade copper resources in the northern portion of the mining licence in the general vicinity of the Bonanza Zone and the Far North Zone, as well as on our adjoining wholly-owned Western Foreland exploration licences, which should allow us to further unlock the exciting potential of this resource area."
Majority of Kamoa's additional copper resources hosted in the ultra-high-grade Bonanza Zone and the Far North Zone
The entire Kamoa Deposit was updated in the new Mineral Resource estimate. The majority of recent drilling, however, targeted the ultra-high-grade Bonanza Zone at Kamoa North, and an approximated north-south corridor of elevated copper grades in the far north of the mining licence area (the Far North Zone).
The new Kamoa Mineral Resource estimate covers approximately 600 metres of strike length in the deeper western portions of the Bonanza Zone (west of the West Scarp Fault), and 1,500 metres of strike length in the shallower eastern portions of the Bonanza Zone, defined by drill sections spaced 50 metres apart on strike in the central section, and 100 metres apart on strike elsewhere.
At a 1% cut-off, the current, combined Indicated Mineral Resources for the Kamoa-Kakula Project now totals 1.387 billion tonnes grading 2.74% copper, containing 83.7 billion pounds of copper. At the same 1% cut-off, Kamoa-Kakula's combined Inferred Mineral Resources now total 339 million tonnes grading 1.68% copper, containing 12.5 billion pounds of copper.
At a higher 3% cut-off, the current, combined Indicated Mineral Resources for the Kamoa-Kakula Project now totals 423 million tonnes grading 4.68% copper, containing 43.7 billion pounds of copper. At the same 3% cut-off, Kamoa-Kakula's combined Inferred Mineral Resources now total 17 million tonnes grading 3.51% copper, containing 1.3 billion pounds of copper.
The new Kamoa Indicated and Inferred Mineral Resource estimate was prepared by George Gilchrist, Ivanhoe Mines' Vice President, Resources, under the direction of Gordon Seibel, RM SME, of the Wood Group (formerly Amec Foster Wheeler E&C Services Inc.) of Reno, USA, and is reported in accordance with the 2014 CIM Definition Standards for Mineral Resources and Mineral Reserves. Mr. Seibel is the Qualified Person for the estimate. The effective date of the estimate is January 30, 2020, and the cut-off date for drill data is January 20, 2020. Details of the estimate are in tables 1 - 9.
There has been no change to the Mineral Reserve estimate at Kamoa-Kakula.
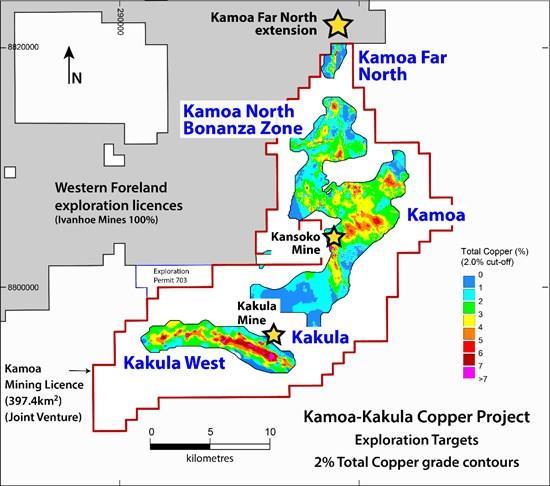
Figure 1: Plan map of the Kamoa-Kakula mining licence (outlined in red), showing the Kakula Deposit, Kamoa North Bonanza Zone, Kamoa Far North Zone and the Kakula and Kakula West deposits. The project's first mine at Kakula is scheduled to begin production in Q3 2021.
To view an enhanced version of Figure 1, please visit:
https://orders.newsfilecorp.com/files/3396/52130_7b208dede4c04923_002full.jpg
The Kamoa-Kakula Copper Project is a joint venture between Ivanhoe Mines (39.6%), Zijin Mining Group (39.6%), Crystal River Global Limited (0.8%) and the DRC government (20%).
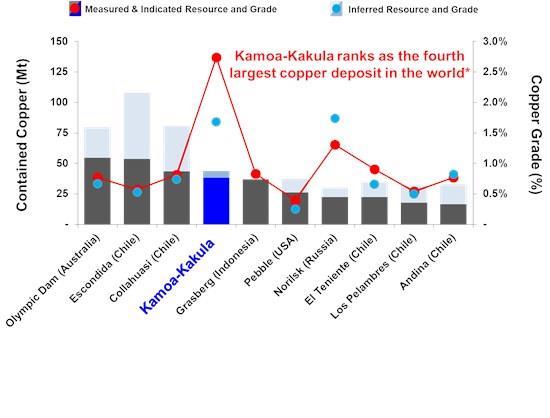
Figure 2: Among the world's largest copper deposits by contained copper, Kamoa-Kakula has the highest copper grades by a wide margin.
To view an enhanced version of Figure 2, please visit:
https://orders.newsfilecorp.com/files/3396/52130_7b208dede4c04923_003full.jpg
Source: Wood Mackenzie
*Note: Selected based on contained copper (Measured & Indicated Mineral Resources, inclusive of Mineral Reserves, and Inferred Mineral Resources), ranked on contained copper in Measured & Indicated Mineral Resources.
Exploration will focus on finding more zones of ultra-high copper mineralization to further boost Kamoa's overall copper grades
The Bonanza and Far North zones were discovered within previously-drilled areas following a review of the mineralization controls evident at the Kansoko, Kakula and Makoko discoveries. An intense focus on understanding these controls and how to recognize them from available data, provided the exploration team at Kamoa-Kakula with the ability to target high-grade zones, leading to infill drilling that included drill holes DD1450 and DD1571, the two highest-grade intersections ever drilled at the Kamoa-Kakula Project.
Two drill rigs currently are drilling in the Kamoa North area, testing the typical Kamoa-Kakula shallow mineralized horizon on previously-identified, high-grade copper trends.
The ultra-high copper grades intercepted to date in the Kamoa North Bonanza Zone are believed to be the result of an east-west growth fault focussing copper-rich fluids to interface with both the typical mineralized horizon at Kamoa-Kakula and the overlying, highly-sulphidic and reduced Kamoa Pyritic Siltstone (KPS). This has resulted in a new, upper mineralized zone hosted in the KPS and characterized by the bonanza-grade copper found in the vicinity of hole DD1450. These two zones combined provide an Indicated Mineral Resource of 12 million tonnes at a copper grade of 4.65%, at a 3% cut-off (Table 7).
Drilling in the Far North Zone has defined 2,500 metres of high-grade copper along an approximately north-south trending fault where fluids have been focussed into a very condensed sequence of basal diamictite and overlying KPS. Drilling north of the Kamoa-Kakula mining licence, on Ivanhoe's 100%-owned Western Foreland exploration licences, has confirmed the continuation of this corridor for at least one kilometre.
In the Kamoa North Bonanza Zone, the typical Kamoa-style mineralization, hosted within the basal diamictite, is flat-lying with shallow dips between 0° and 10°, whilst ultra-high copper grades hosted within the overlying KPS dip at steeper angles (40°). The eastern portion of the Bonanza Zone (east of the West Scarp Fault) and the Far North Zone occur in a shallow part of the deposit, with the vast majority of the Mineral Resource <250 metres below surface.
Lineaments in the aeromagnetic data, thought to be the controlling structures, can be traced along trend into Ivanhoe's adjoining, 100%-owned Western Foreland exploration licences.
Kakula's Mineral Resource also updated for the upcoming Feasibility Study
The project geological team also updated the Mineral Resource estimate for the Kakula Deposit. This updated resource estimate, which has an effective date of November 10, 2018, will be incorporated into the Definitive Feasibility Study for the Kakula Deposit that is being prepared.
Kakula's updated Indicated Mineral Resources total 627 million tonnes grading 2.74% copper, at a 1% cut-off grade, containing 37.9 million pounds of copper. At the same cut-off, Kakula has an additional Inferred Mineral Resource of 104 million tonnes grading 1.61% copper, containing 3.7 million pounds of copper.

A drill rig in action at the Kamoa North Bonanza Zone.
To view an enhanced version of this graphic, please visit:
https://orders.newsfilecorp.com/files/3396/52130_7b208dede4c04923_004full.jpg
A drill rig in action at the Kamoa North Bonanza Zone.
To view an enhanced version of this graphic, please visit:
https://orders.newsfilecorp.com/files/3396/52130_7b208dede4c04923_005full.jpg
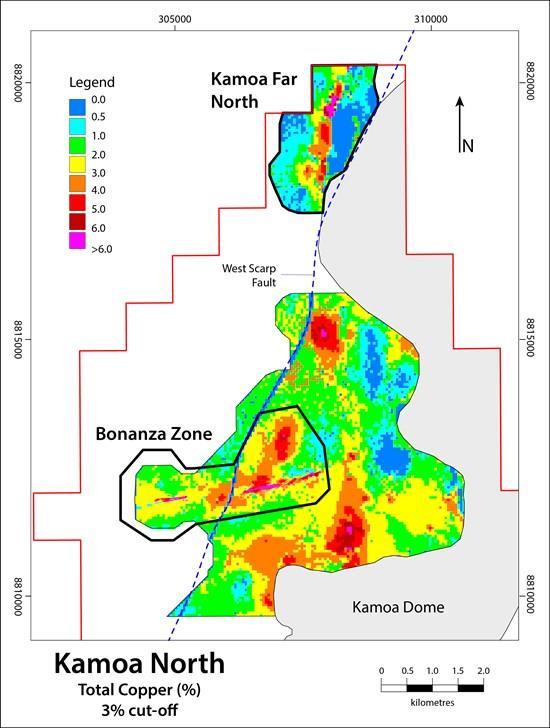
Figure 3: Plan map showing the copper grades in the Kamoa North Bonanza Zone and the Kamoa Far North Zone.
To view an enhanced version of Figure 3, please visit:
https://orders.newsfilecorp.com/files/3396/52130_7b208dede4c04923_006full.jpg
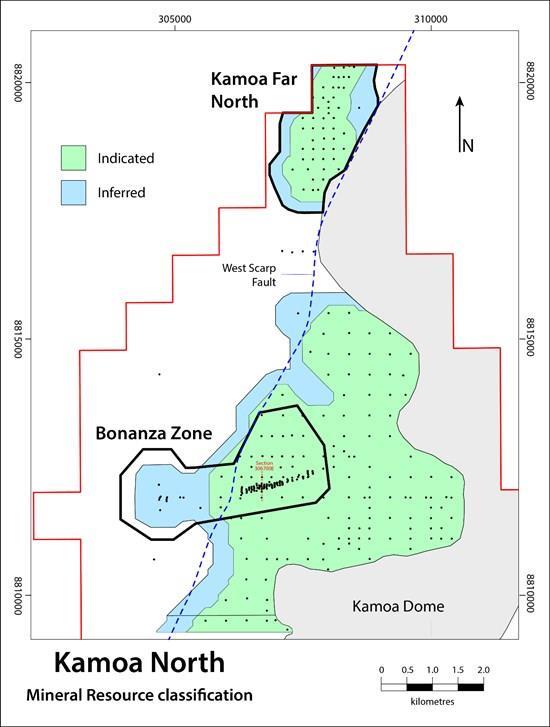
Figure 4: Plan map showing the Mineral Resource classification of the Kamoa North Bonanza Zone and the Kamoa Far North Zone.
To view an enhanced version of Figure 4, please visit:
https://orders.newsfilecorp.com/files/3396/52130_7b208dede4c04923_007full.jpg

Figure 5: Section showing the copper grades in the Kamoa North Bonanza Zone.
To view an enhanced version of Figure 5, please visit:
https://orders.newsfilecorp.com/files/3396/52130_7b208dede4c04923_008full.jpg
To view an enhanced version of this graphic, please visit:
https://orders.newsfilecorp.com/files/3396/52130_7b208dede4c04923_009full.jpg
To view an enhanced version of this graphic, please visit:
https://orders.newsfilecorp.com/files/3396/52130_7b208dede4c04923_010full.jpg
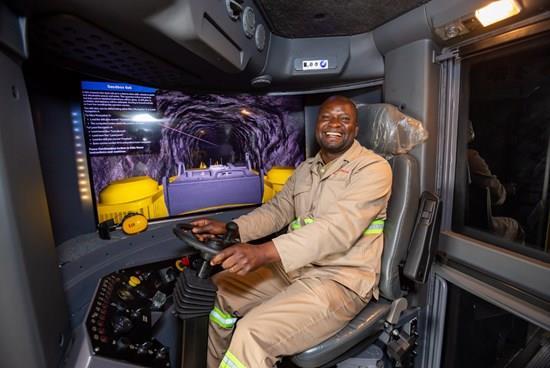
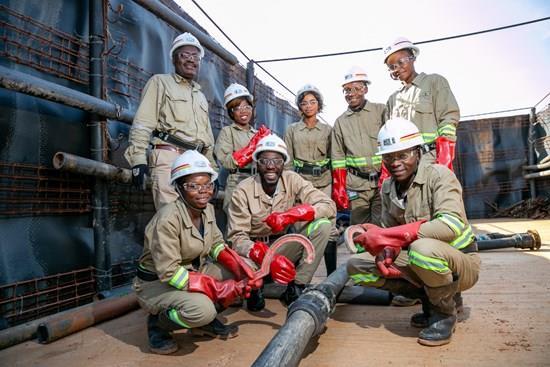
Kamoa-Kakula is training a new generation of young Congolese women and men to safely operate the new, modern, underground copper mine being built at Kakula.
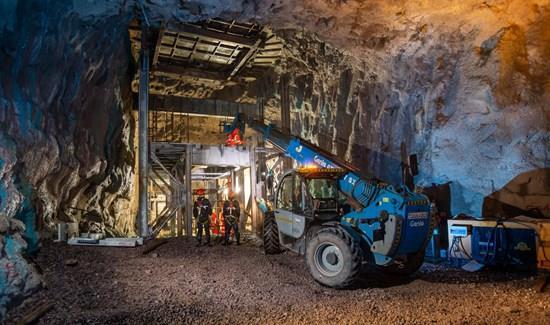
Construction is nearing completion on the underground ore transfer station, which is part of the ore-handling infrastructure at the Kakula Mine.
To view an enhanced version of this graphic, please visit:
https://orders.newsfilecorp.com/files/3396/52130_7b208dede4c04923_011full.jpg

Excellent progress is being made on the high-volume conveyor system that will transport broken ore from underground to the surface processing plant, which is scheduled to begin operation in April 2020.
To view an enhanced version of this graphic, please visit:
https://orders.newsfilecorp.com/files/3396/52130_7b208dede4c04923_012full.jpg
Table 1: Kamoa Indicated and Inferred Mineral Resource (at 1% TCu Cut-off Grade), January 30 th , 2020
| Category | Tonnage
(Mt) | Area
(km 2 ) | Copper
(%) | Vertical
Thickness
(m) | Contained
Copper
(kt) | Contained
Copper
(billion lbs) |
| Indicated | 760 | 55.2 | 2.73 | 5.0 | 20,800 | 45.8 |
| Inferred | 235 | 21.8 | 1.70 | 4.0 | 4,010 | 8.8 |
Ivanhoe's Vice President, Resources, George Gilchrist, a Fellow of the Geology Society of South Africa and Professional Natural Scientist (Pr. Sci. Nat) with the South African Council for Natural Scientific Professions (SACNASP), estimated the Mineral Resources under the supervision of Gordon Seibel, a Registered Member (RM) of the Society for Mining, Metallurgy and Exploration (SME), an employee of Wood Group, who is the Qualified Person for the Mineral Resource estimate. The effective date of the estimate is January 30, 2020 and the cut-off date for drill data is January 20, 2020. Mineral Resources are estimated using the CIM 2014 Definition Standards for Mineral Resources and Mineral Reserves. Mineral Resources are reported inclusive of Mineral Reserves on a 100% basis. Mineral Resources are reported using a total copper (TCu) cut-off grade of 1% TCu and a minimum vertical thickness of 3 m. There are reasonable prospects for eventual economic extraction under assumptions of a copper price of US$3.00/lb, employment of underground mechanized room-and-pillar and drift-and-fill mining methods, and that copper concentrates will be produced and sold to a smelter. Mining costs are assumed to be US$27/t. Concentrator, tailings treatment, and general and administrative costs (G&A) are assumed to be US$17/t. Metallurgical recoveries are expected to average 84% (86% for hypogene and 81% for supergene). At a 1% TCu cut-off grade, assumed net smelter returns for 100% of Mineral Resource blocks will cover processing, tailings treatment and G&A costs. Reported Mineral Resources contain no allowances for hanging wall or foot wall contact boundary loss and dilution. No mining recovery has been applied. Depth of mineralization below the surface ranges from 10 m to 1,320 m for Indicated Mineral Resources and 20 m to 1,560 m for Inferred Mineral Resources. Approximate drill-hole spacings are 800 m for Inferred Mineral Resources and 400 m for Indicated Mineral Resources. The average dip of the deposit within the Indicated and Inferred Mineral Resource outlines is 12.7 degrees. Vertical thickness approximates true thickness at Kamoa. Rounding as required by reporting guidelines may result in apparent summation differences between tonnes, grade and contained metal content. Table 2: Kakula: Indicated and Inferred Mineral Resource (at 1% TCu Cut-off Grade), November 10 th , 2018
| Category | Tonnage
(Mt) | Area
(km 2 ) | Copper
(%) | Vertical
Thickness
(m) | Contained Copper (kt) | Contained
Copper
(billion lbs) |
| Indicated | 627 | 21.7 | 2.74 | 10.3 | 17,200 | 37.9 |
| Inferred | 104 | 5.6 | 1.61 | 6.7 | 1,680 | 3.7 |
Ivanhoe's Vice President, Resources, George Gilchrist, a Fellow of the Geology Society of South Africa and Professional Natural Scientist (Pr. Sci. Nat) with the South African Council for Natural Scientific Professions (SACNASP), estimated the Mineral Resources under the supervision of Gordon Seibel, a Registered Member (RM) of the Society for Mining, Metallurgy and Exploration (SME), an employee of Wood Group, who is the Qualified Person for the Mineral Resources. The effective date of the estimate for Kakula is November 10, 2018, and the cut-off date for the drill data is November 1, 2018. Mineral Resources are estimated using the CIM Definition Standards for Mineral Resources and Reserves (2014) and reported on a 100% basis. Mineral Resources are reported inclusive of Mineral Reserves on a 100% basis. Mineral Resources are reported using a total copper (TCu) cut-off grade of 1% TCu and an approximate minimum thickness of 3 m. There are reasonable prospects for eventual economic extraction under assumptions of a copper price of US$3.00/lb, employment of underground, mechanized, room-and-pillar and drift-and-fill mining methods, and that copper concentrates will be produced and sold to a smelter. Mining costs are assumed to be US$42/t. Concentrator, tailings treatment and general and administrative (G&A) costs are assumed to be US$18/t. Metallurgical recovery is assumed to average 85%. Ivanhoe is studying reducing mining costs using a controlled convergence room-and-pillar method. At a 1% TCu cut-off grade, assumed net smelter returns for 100% of Mineral Resource blocks will cover concentrator, tailings treatment and G&A costs. Reported Mineral Resources contain no allowances for hanging wall or footwall contact boundary loss and dilution. No mining recovery has been applied. Approximate drill-hole spacings are 800 m for Inferred Mineral Resources and 400 m for Indicated Mineral Resources. The average dip of the deposit within the Indicated and Inferred Mineral Resource outlines is 17.8 degrees. Vertical thickness approximates true thickness at Kakula. Rounding as required by reporting guidelines may result in apparent differences between tonnes, grade and contained metal content. Table 3: Kamoa and Kakula: Indicated and Inferred Mineral Resource (at 1% TCu Cut-off Grade), January 30 th , 2020
| Deposit | Category | Tonnes
(millions) | Area
(km 2 ) | Copper
Grade
(%) | Vertical
Thickness
(m) | Contained
Copper (kt) | Contained
Copper
(billion lbs) |
| Kamoa | Indicated | 760 | 55.2 | 2.73 | 5.0 | 20,800 | 45.8 |
| Inferred | 235 | 21.8 | 1.70 | 4.0 | 4,010 | 8.8 |
| Kakula | Indicated | 627 | 21.7 | 2.74 | 10.3 | 17,200 | 37.9 |
| Inferred | 104 | 5.6 | 1.61 | 6.7 | 1,680 | 3.7 |
| Total Kamoa-Kakula Project | Indicated | 1,387 | 77.0 | 2.74 | 6.5 | 38,000 | 83.7 |
| Inferred | 339 | 27.4 | 1.68 | 4.5 | 5,690 | 12.5 |
The footnotes to Table 1 (Kamoa Mineral Resource) and Table 2 (Kakula Mineral Resource) also apply to this table.
Table 4: Kamoa: Sensitivity of Mineral Resources to cut-off grade
| Indicated Mineral Resource |
Cut-off
(% Cu) | Tonnage
(Mt) | Area
(km 2 ) | Copper
(%) | Vertical
Thickness
(m) | Contained
Copper
(kt) | Contained
Copper
(billion lbs) |
| 5.00 | 44 | 4.5 | 6.14 | 3.5 | 2,690 | 5.9 |
| 4.50 | 67 | 6.7 | 5.65 | 3.6 | 3,800 | 8.4 |
| 4.00 | 107 | 10.4 | 5.13 | 3.7 | 5,490 | 12.1 |
| 3.50 | 171 | 16.4 | 4.61 | 3.7 | 7,890 | 17.4 |
| 3.00 | 256 | 24.0 | 4.15 | 3.8 | 10,700 | 23.5 |
| 2.50 | 369 | 32.8 | 3.73 | 4.1 | 13,700 | 30.3 |
| 2.00 | 504 | 41.5 | 3.33 | 4.4 | 16,800 | 37.0 |
| 1.50 | 655 | 49.4 | 2.97 | 4.8 | 19,400 | 42.8 |
| 1.00 | 760 | 55.2 | 2.73 | 5.0 | 20,800 | 45.8 |
| 0.50 | 1,185 | 59.4 | 1.99 | 7.3 | 23,600 | 52.0 |
| Inferred Mineral Resource |
| 4.00 | 1 | 0.1 | 5.47 | 3.4 | 55 | 0.1 |
| 3.50 | 4 | 0.5 | 4.12 | 3.1 | 177 | 0.4 |
| 3.00 | 13 | 1.5 | 3.51 | 3.1 | 441 | 1.0 |
| 2.50 | 30 | 3.5 | 3.08 | 3.0 | 910 | 2.0 |
| 2.00 | 58 | 6.5 | 2.66 | 3.2 | 1,540 | 3.4 |
| 1.50 | 113 | 11.9 | 2.20 | 3.4 | 2,480 | 5.5 |
| 1.00 | 235 | 21.8 | 1.70 | 4.0 | 4,010 | 8.8 |
| 0.50 | 680 | 31.4 | 1.01 | 8.0 | 6,860 | 15.1 |
The footnotes to Table 1 also apply to this table.
Table 5: Kakula: Sensitivity of Mineral Resources to cut-off grade
| Indicated Mineral Resource |
Cut-off
(% Cu) | Tonnage
(Mt) | Area
(km 2 ) | Copper
(%) | Vertical
Thickness
(m) | Contained
Copper
(kt) | Contained
Copper
(billion lbs) |
| 5.00 | 77 | 5.9 | 7.48 | 4.5 | 5,730 | 12.6 |
| 4.50 | 91 | 7.0 | 7.04 | 4.5 | 6,440 | 14.2 |
| 4.00 | 109 | 8.3 | 6.58 | 4.6 | 7,200 | 15.9 |
| 3.50 | 132 | 9.9 | 6.09 | 4.7 | 8,060 | 17.8 |
| 3.00 | 167 | 11.8 | 5.50 | 5.0 | 9,180 | 20.2 |
| 2.50 | 218 | 14.3 | 4.85 | 5.4 | 10,600 | 23.3 |
| 2.00 | 318 | 17.5 | 4.02 | 6.5 | 12,800 | 28.2 |
| 1.50 | 435 | 19.6 | 3.41 | 7.9 | 14,900 | 32.7 |
| 1.00 | 627 | 21.7 | 2.74 | 10.3 | 17,200 | 37.9 |
| 0.50 | 939 | 22.6 | 2.08 | 14.9 | 19,500 | 43.0 |
| Inferred Mineral Resource |
| 4.00 | 1 | 0.1 | 4.41 | 3.3 | 33 | 0.1 |
| 3.50 | 2 | 0.2 | 4.04 | 3.6 | 67 | 0.1 |
| 3.00 | 5 | 0.4 | 3.52 | 3.9 | 168 | 0.4 |
| 2.50 | 10 | 1.0 | 3.10 | 3.7 | 324 | 0.7 |
| 2.00 | 22 | 2.0 | 2.64 | 3.9 | 583 | 1.3 |
| 1.50 | 45 | 3.7 | 2.18 | 4.3 | 974 | 2.1 |
| 1.00 | 104 | 5.6 | 1.61 | 6.7 | 1,680 | 3.7 |
| 0.50 | 257 | 7.9 | 1.08 | 11.7 | 2,770 | 6.1 |
The footnotes to Table 2 also apply to this table.
Table 6: Kamoa-Kakula: Sensitivity of combined Kamoa-Kakula Mineral Resources to cut-off grade
| Indicated Mineral Resource |
Cut-off
(% Cu) | Tonnage
(Mt) | Area
(km 2 ) | Copper
(%) | Vertical Thickness
(m) | Contained
Copper
(kt) | Contained
Copper
(billion lbs) |
| 5.00 | 120 | 10.4 | 6.99 | 4.1 | 8,420 | 18.6 |
| 4.50 | 159 | 13.7 | 6.45 | 4.1 | 10,200 | 22.6 |
| 4.00 | 217 | 18.7 | 5.86 | 4.1 | 12,700 | 28.0 |
| 3.50 | 304 | 26.3 | 5.25 | 4.1 | 16,000 | 35.2 |
| 3.00 | 423 | 35.8 | 4.68 | 4.2 | 19,900 | 43.7 |
| 2.50 | 587 | 47.1 | 4.14 | 4.5 | 24,300 | 53.6 |
| 2.00 | 823 | 59.0 | 3.60 | 5.0 | 29,600 | 65.3 |
| 1.50 | 1,090 | 69.0 | 3.15 | 5.7 | 34,300 | 75.6 |
| 1.00 | 1,387 | 77.0 | 2.74 | 6.5 | 38,000 | 83.7 |
| 0.50 | 2,123 | 82.0 | 2.03 | 9.4 | 43,100 | 95.0 |
| Inferred Mineral Resource |
| 4.00 | 2 | 0.2 | 5.02 | 3.4 | 88 | 0.2 |
| 3.50 | 6 | 0.6 | 4.10 | 3.2 | 244 | 0.5 |
| 3.00 | 17 | 1.9 | 3.51 | 3.2 | 609 | 1.3 |
| 2.50 | 40 | 4.5 | 3.08 | 3.2 | 1,230 | 2.7 |
| 2.00 | 80 | 8.5 | 2.66 | 3.4 | 2,120 | 4.7 |
| 1.50 | 157 | 15.6 | 2.19 | 3.6 | 3,450 | 7.6 |
| 1.00 | 339 | 27.4 | 1.68 | 4.5 | 5,690 | 12.5 |
| 0.50 | 937 | 39.3 | 1.03 | 8.7 | 9,630 | 21.2 |
The footnotes to Table 1 and Table 2 also apply to this table.
Table 7: Kamoa Bonanza Zone: Sensitivity of Mineral Resources to cut-off grade
| Indicated Mineral Resource |
Cut-off
(% Cu) | Tonnage
(Mt) | Area
(km 2 ) | Copper
(%) | Vertical
Thickness
(m) | Contained
Copper
(kt) | Contained
Copper
(billion lbs) |
| 5.00 | 2 | 0.1 | 8.89 | 6.9 | 212 | 0.5 |
| 4.50 | 3 | 0.2 | 7.85 | 5.8 | 250 | 0.6 |
| 4.00 | 4 | 0.3 | 6.84 | 5.0 | 303 | 0.7 |
| 3.50 | 8 | 0.7 | 5.53 | 4.2 | 421 | 0.9 |
| 3.00 | 12 | 1.1 | 4.65 | 4.1 | 574 | 1.3 |
| 2.50 | 20 | 1.8 | 3.95 | 4.0 | 773 | 1.7 |
| 2.00 | 27 | 2.4 | 3.50 | 4.2 | 933 | 2.1 |
| 1.50 | 33 | 2.8 | 3.15 | 4.4 | 1,050 | 2.3 |
| 1.00 | 37 | 3.1 | 2.95 | 4.5 | 1,100 | 2.4 |
| 0.50 | 49 | 3.4 | 2.41 | 5.4 | 1,170 | 2.6 |
| Inferred Mineral Resource |
| 3.00 | 1 | 0.1 | 5.35 | 4.1 | 41 | 0.1 |
| 2.50 | 2 | 0.2 | 3.84 | 3.4 | 72 | 0.2 |
| 2.00 | 9 | 0.8 | 2.55 | 3.8 | 227 | 0.5 |
| 1.50 | 16 | 1.5 | 2.20 | 4.1 | 362 | 0.8 |
| 1.00 | 19 | 1.6 | 2.09 | 4.3 | 388 | 0.9 |
| 0.50 | 55 | 1.6 | 1.11 | 12.2 | 612 | 1.3 |
The footnotes to Table 1 also apply to this table. This table forms a subset of the Kamoa Mineral Resource reported in Table 4; it is not additive to Table 4.
Table 8: Kamoa Bonanza Zone hosted within the KPS: Sensitivity of Mineral Resources to cut-off grade
| Indicated Mineral Resource |
Cut-off
(% Cu) | Tonnage
(Mt) | Area
(km 2 ) | Copper
(%) | Vertical
Thickness
(m) | Contained
Copper
(kt) | Contained
Copper
(billion lbs) |
| 5.00 | 1.5 | 0.06 | 10.68 | 10.5 | 162 | 0.36 |
| 4.50 | 1.6 | 0.06 | 10.52 | 10.4 | 165 | 0.36 |
| 4.00 | 1.6 | 0.06 | 10.35 | 10.4 | 167 | 0.37 |
| 3.50 | 1.6 | 0.06 | 10.22 | 10.4 | 168 | 0.37 |
| 3.00 | 1.7 | 0.06 | 10.11 | 10.4 | 169 | 0.37 |
| 2.50 | 1.7 | 0.06 | 9.95 | 10.3 | 170 | 0.37 |
| 2.00 | 1.7 | 0.07 | 9.77 | 10.2 | 171 | 0.38 |
| 1.50 | 1.8 | 0.07 | 9.68 | 10.2 | 171 | 0.38 |
| 1.00 | 1.8 | 0.07 | 9.55 | 10.1 | 172 | 0.38 |
| 0.50 | 1.8 | 0.07 | 9.44 | 10.1 | 172 | 0.38 |
| Inferred Mineral Resource |
| 3.00 | 0.4 | 0.03 | 6.95 | 4.9 | 30 | 0.1 |
| 2.50 | 0.5 | 0.03 | 6.74 | 4.9 | 30 | 0.1 |
| 2.00 | 0.5 | 0.03 | 6.52 | 5.0 | 31 | 0.1 |
| 1.50 | 0.5 | 0.03 | 6.24 | 5.3 | 32 | 0.1 |
| 1.00 | 0.5 | 0.03 | 6.24 | 5.2 | 32 | 0.1 |
| 0.50 | 0.5 | 0.03 | 6.24 | 5.2 | 32 | 0.1 |
The footnotes to Table 1 also apply to this table. This table forms a subset of the Kamoa Bonanza Zone Mineral Resource reported in Table 7; it is not additive to Table 7.
Table 9: Kamoa Far North: Sensitivity of Mineral Resources to cut-off grade
| Indicated Mineral Resource |
Cut-off
(% Cu) | Tonnage
(Mt) | Area
(km 2 ) | Copper
(%) | Vertical
Thickness
(m) | Contained
Copper
(kt) | Contained
Copper
(billion lbs) |
| 5.00 | 1 | 0.1 | 7.17 | 4.0 | 78 | 0.17 |
| 4.50 | 1 | 0.1 | 6.58 | 3.9 | 94 | 0.21 |
| 4.00 | 2 | 0.2 | 5.69 | 4.0 | 133 | 0.29 |
| 3.50 | 3 | 0.3 | 5.09 | 4.0 | 171 | 0.38 |
| 3.00 | 5 | 0.5 | 4.49 | 4.0 | 222 | 0.49 |
| 2.50 | 7 | 0.7 | 3.92 | 4.2 | 287 | 0.63 |
| 2.00 | 11 | 0.9 | 3.39 | 4.5 | 365 | 0.80 |
| 1.50 | 15 | 1.1 | 2.97 | 4.9 | 432 | 0.95 |
| 1.00 | 18 | 1.4 | 2.65 | 4.7 | 473 | 1.04 |
| 0.50 | 24 | 1.9 | 2.15 | 4.7 | 517 | 1.14 |
| Inferred Mineral Resource |
| 1.50 | 0.2 | 0.04 | 1.97 | 2.7 | 5 | 0.01 |
| 1.00 | 2 | 0.2 | 1.32 | 2.9 | 21 | 0.05 |
| 0.50 | 6 | 0.8 | 0.88 | 2.9 | 50 | 0.11 |
The footnotes to Table 1 also apply to this table. This table forms a subset of the Kamoa Mineral Resource reported in Table 4; it is not additive to Table 4.
Data verification and quality control and assurance
Amec Foster Wheeler, a Wood company (Wood), reviewed the sample chain of custody, quality assurance and control procedures, and qualifications of analytical laboratories. Wood is of the opinion that the procedures and QA/QC control are acceptable to support Mineral Resource estimation. Wood also audited the assay database, core logging, and geological interpretations on a number of occasions between 2009 and 2020, and has found no material issues with the data as a result of these audits.
In the opinion of the Wood Qualified Persons, the data verification programs undertaken on the data collected from the Kamoa-Kakula Project support the geological interpretations. The analytical and database quality and the data collected can support Mineral Resource estimation.
Ivanhoe Mines maintains a comprehensive chain of custody and QA/QC program on assays from its Kamoa-Kakula Copper Project. Half-sawn core is processed at its on-site preparation laboratory in Kamoa, prepared samples then are shipped by secure courier to Bureau Veritas Minerals (BVM) Laboratories in Australia, an ISO17025 accredited facility. Copper assays are determined at BVM by mixed-acid digestion with ICP finish. Industry-standard certified reference materials and blanks are inserted into the sample stream prior to dispatch to BVM.
The most recently-filed technical report for the project is the Kamoa-Kakula Integrated Development Plan 2019 dated March 18, 2019, prepared by OreWin Pty Ltd., Amec Foster Wheeler E&C Services Inc. (a division of Wood plc), DRA Global, SRK Consulting (South Africa) (Pty) Ltd. and Stantec Consulting International LLC., available on the SEDAR profile of Ivanhoe Mines at www.sedar.com or under technical reports on the Ivanhoe Mines website at www.ivanhoemines.com .
Qualified Persons
Disclosures of a scientific or technical nature in this news release have been reviewed and approved by Stephen Torr, who is considered, by virtue of his education, experience and professional association, a Qualified Person under the terms of NI 43-101. Mr. Torr is not considered independent under NI 43-101 as he is the Vice President, Project Geology and Evaluation. Mr. Torr has verified the other technical data disclosed in this news release.
The current, independent, NI 43-101 technical report for the Kamoa-Kakula Project, is available under the company's SEDAR profile at www.sedar.com . The Kamoa-Kakula Integrated Development Plan 2019 dated March 18, 2019, prepared by OreWin Pty Ltd., Wood Group (formerly Amec Foster Wheeler E&C Services Inc.), DRA Global, SRK Consulting (South Africa) (Pty) Ltd. and Stantec Consulting International LLC, covering the company's Kamoa-Kakula Project.
These technical report include relevant information regarding the assumptions, parameters and methods used to calculate the mineral resource estimates on the Kamoa-Kakula Project cited in this news release, as well as the effective date of earlier mineral resource estimates and information regarding data verification, exploration procedures and other matters relevant to the scientific and technical disclosure contained in this news release in respect of the Kamoa-Kakula Project.
Information contacts
Investors: Bill Trenaman +1.604.331.9834
Media: Matthew Keevil +1.604. 558.1034
Website www.ivanhoemines.com
Forward-looking statements
Certain statements in this news release constitute "forward-looking statements" or "forward-looking information" within the meaning of applicable securities laws. Such statements and information involve known and unknown risks, uncertainties and other factors that may cause the actual results, performance or achievements of the company, its projects, or industry results, to be materially different from any future results, performance or achievements expressed or implied by such forward-looking statements or information. Such statements can be identified by the use of words such as "may", "would", "could", "will", "intend", "expect", "believe", "plan", "anticipate", "estimate", "scheduled", "forecast", "predict" and other similar terminology, or state that certain actions, events or results "may", "could", "would", "might" or "will" be taken, occur or be achieved. These statements reflect the company's current expectations regarding future events, performance and results and speak only as of the date of this release.
Such statements include without limitation, the timing and results of: (i) statements regarding the Kakula Deposit is being fast-tracked to commercial production, with the initial 3.8 million-tonne-per-annum mining operation scheduled to produce first concentrate in Q3 2021; and (ii) statements regarding Kamoa's exploration will focus on finding more zones of ultra-high copper to further boost Kamoa's overall copper grades.
This news release also contains references to estimates of Mineral Resources and Mineral Reserves. The estimation of Mineral Resources is inherently uncertain and involves subjective judgments about many relevant factors. Estimates of Mineral Reserves provide more certainty but still involve similar subjective judgments. Mineral Resources that are not Mineral Reserves do not have demonstrated economic viability. The accuracy of any such estimates is a function of the quantity and quality of available data, and of the assumptions made and judgments used in engineering and geological interpretation (including estimated future production from the company's projects, the anticipated tonnages and grades that will be mined and the estimated level of recovery that will be realized), which may prove to be unreliable and depend, to a certain extent, upon the analysis of drilling results and statistical inferences that ultimately may prove to be inaccurate. Mineral Resource or Mineral Reserve estimates may have to be re-estimated based on: (i) fluctuations in copper prices; (ii) results of drilling; (iii) metallurgical testing and other studies; (iv) proposed mining operations, including dilution; (v) the evaluation of mine plans subsequent to the date of any estimates and/or changes in mine plans; (vi) the possible failure to receive required permits, approvals and licences; and (vii) changes in law or regulation.
Forward-looking statements and information involve significant risks and uncertainties, should not be read as guarantees of future performance or results and will not necessarily be accurate indicators of whether or not such results will be achieved. A number of factors could cause actual results to differ materially from the results discussed in the forward-looking statements or information, including, but not limited to, the factors discussed under "Risk Factors" and elsewhere in the company's Q3 2019 MD&A, as well as unexpected changes in laws, rules or regulations, or their enforcement by applicable authorities; the failure of parties to contracts with the company to perform as agreed; social or labour unrest; changes in commodity prices; and the failure of exploration programs or studies to deliver anticipated results or results that would justify and support continued exploration, studies, development or operations.
Although the forward-looking statements contained in this news release are based upon what management of the company believes are reasonable assumptions, the company cannot assure investors that actual results will be consistent with these forward-looking statements.
These forward-looking statements are made as of the date of this news release and are expressly qualified in their entirety by this cautionary statement. Subject to applicable securities laws, the company does not assume any obligation to update or revise the forward-looking statements contained herein to reflect events or circumstances occurring after the date of this news release.
The company's actual results could differ materially from those anticipated in these forward-looking statements as a result of the factors set forth in the "Risk Factors" section and elsewhere in the company's Q3 2019 MD&A, unaudited condensed consolidated interim financial statements for the three and nine months ended September 30, 2019 and its Annual Information Form.

To view the source version of this press release, please visit https://www.newsfilecorp.com/release/52130

MENAFN0502202000703983ID1099654505