(MENAFN- The Conversation) Increasing numbers of students are being excluded from Australian schools. This is done both temporarily, through informal and formal suspensions, and permanently, through expelling them and cancelling their enrolments.
We know from publicly available data in New South Wales , South Australia and Queensland that these exclusions begin in the first year of school when children can be as young as four years old.
Informal exclusions are more common at this stage and usually occur in the form of a phone call requesting parents“take home” their child.
But because exclusionary discipline does not address the issues underlying childrens' behaviour — and can reinforce it — short informal exclusions quickly progress to longer, formal suspensions. And because suspension still doesn't solve the problem, one suspension can become many.
This progression was clearly laid out in analyses conducted during last year's Inquiry into Suspension, Exclusion and Expulsion processes in South Australian Government Schools .
4 in 5 suspended students have disability
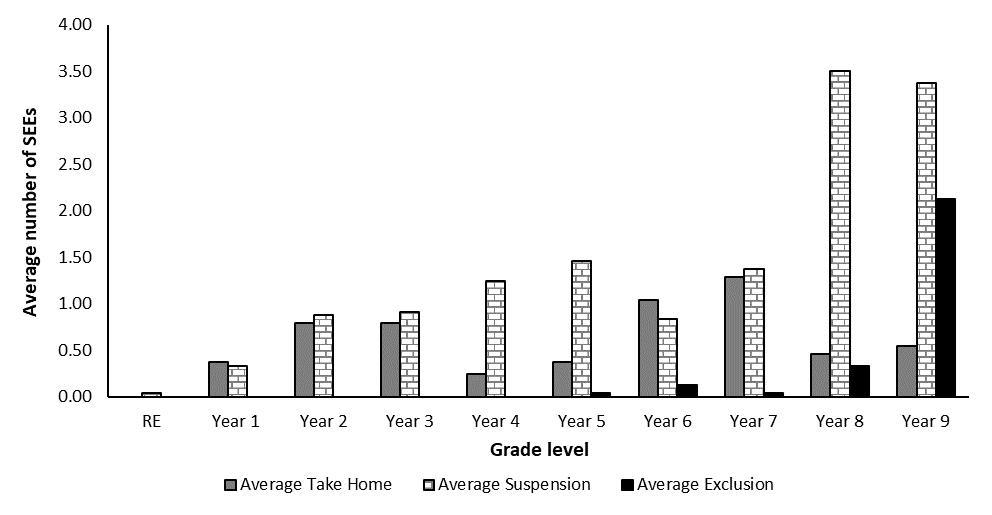
One analysis retrospectively tracked the average number of take-homes, suspensions and exclusions for 24 students who were in year 9 in 2019. It illustrates the graduation from shorter and less severe, to longer and more severe, exclusions over time.
A small number of take-homes progressed to more take-homes, then to suspensions, more suspensions and eventually to exclusions, which are longer-term suspensions. In South Australia, these are four to ten weeks in length (exclusions in other states are the same as expulsions).
How small exclusions become bigger over time

Average number of take homes, suspensions and exclusions received by 24 students, who received more than one exclusion in 2019 from reception to Year 9. SA education department data, unpublished, September 2020. Another analysis conducted as part of the inquiry showed while the majority of students suspended (56.8%) accounted for just over one quarter of suspensions (28.7%), the majority of suspensions (71.3%) went to students suspended two or more times.
The red box in the graph below shows the percentage of students receiving one suspension in 2019.
Most suspensions in 2019 went to students suspended two or more times
Percentage of students per number of times suspended compared to the percentage of incidents each group represents, in 2019. SA Department for Education data collections, unpublished, September 2020. What this means is that 42.8% of students suspended in 2019 received more than one suspension in that year, with 42 students receiving ten or more. Four in five of these 42 students had a disability.
The blue box in the above graph highlights the percentage of suspended students (7.8%) who received five or more suspensions in 2019. Together, these 804 students accounted for almost as many suspensions (24.7%) as students in the much larger (red) group who were only suspended once.
As with the students suspended ten or more times, four in five students suspended more than five times had a disability.
Indigenous students overrepresented
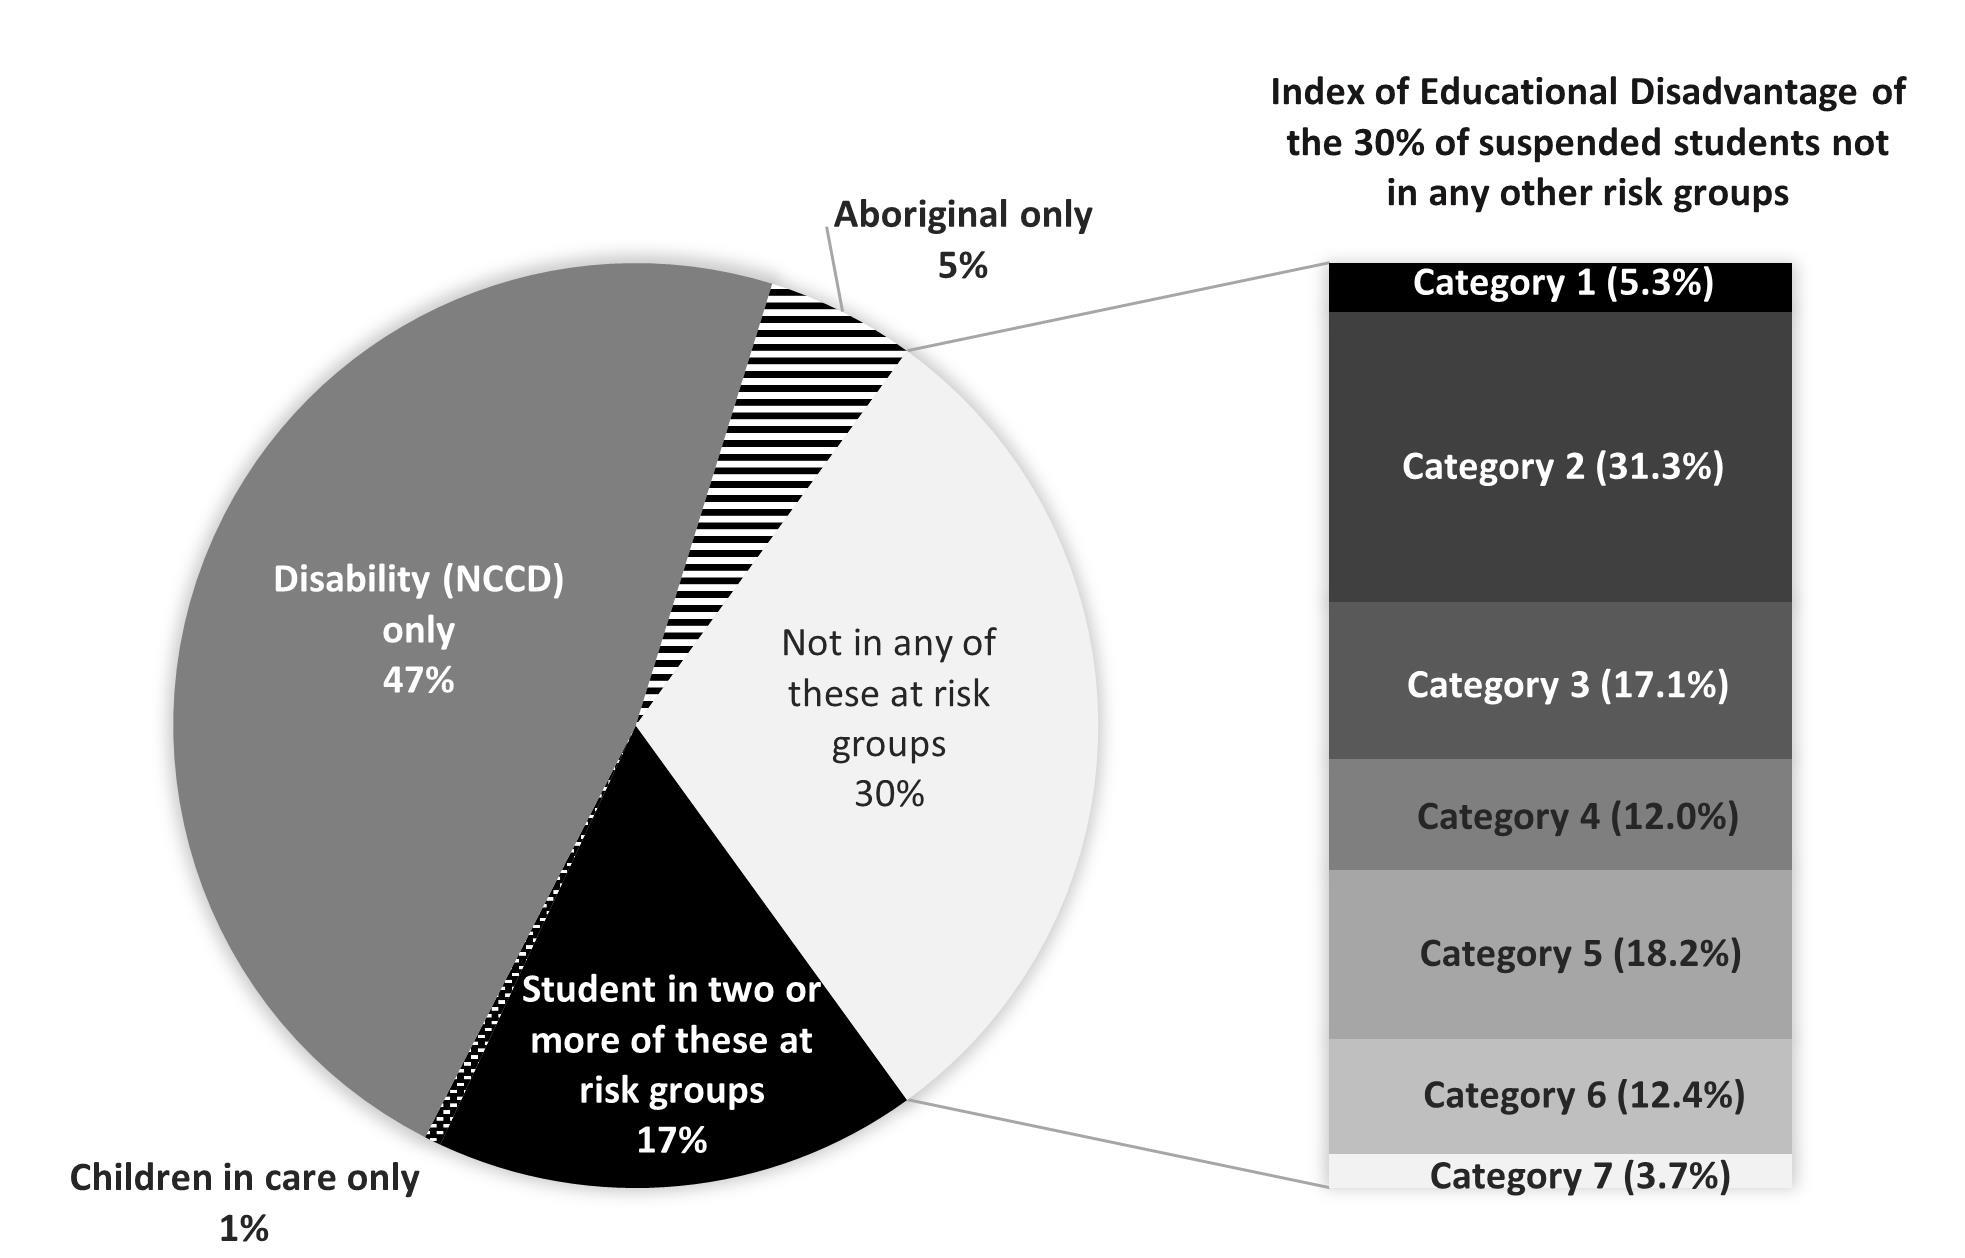
Along with students with a disability, Indigenous students and those living in out-of-home care are also massively overrepresented in suspension and exclusion statistics. These are not distinct groups. It is possible to be Indigenous, have a disability and be living in care.
Analysis of South Australian data separated by group shows close to one in five suspensions in 2019 (17%) went to students in two or more of these groups.
Most suspensions in 2019 went to very vulnerable students

Distribution of suspensions across risk groups and the school index of educational disadvantage (1=most disadvantaged, 7=least disadvantaged). SA Department for Education data collections, unpublished, September 2020. Further analysis showed two out of three of these suspensions went to Indigenous students with a disability, followed by children with a disability living in care. Just over one in ten of these suspensions were given to Indigenous children with a disability living in care.
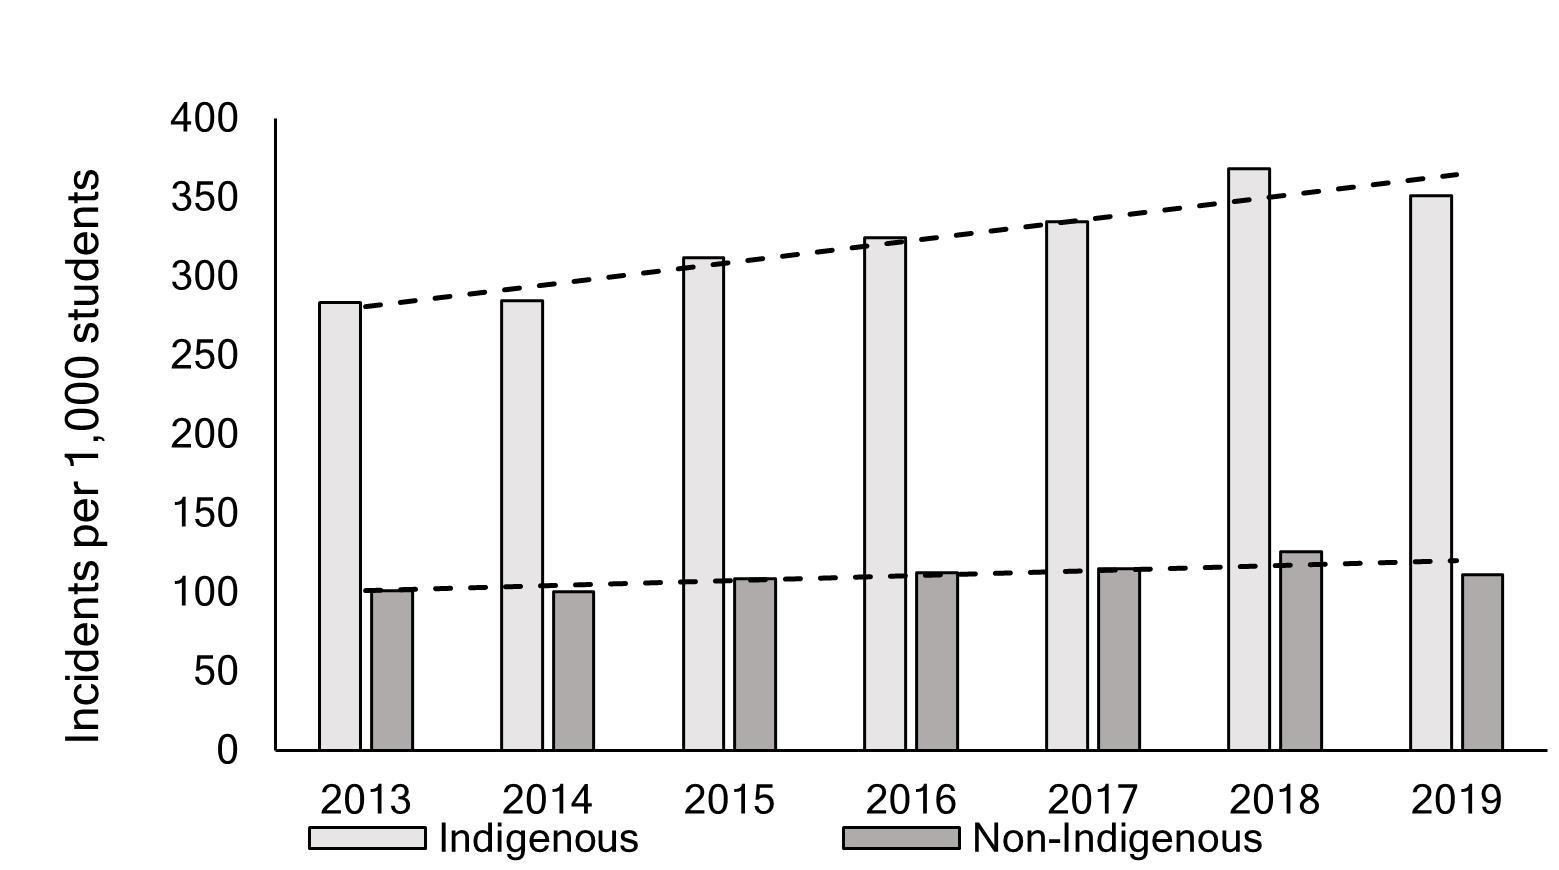
New research to be presented at QUT Centre for Inclusive Education 's forum on reducing school exclusion this week shows in 2019 in Queensland, there were 350.8 suspension incidents per 1,000 Indigenous students compared to 110.9 for non-Indigenous students.
Read more: NSW wants to change rules on suspending and expelling students. How does it compare to other states?
Put another way, an Indigenous student in Queensland may have a one-in-three chance of being suspended, although it is likely a substantial proportion are receiving multiple (repeat) suspensions.
Worryingly, longitudinal trends show a significant increase in suspension incidents over the seven years between 2013 and 2019. And the rate of increase for Indigenous students is significantly faster than non-Indigenous students.
Suspension rates for Indigenous students growing much faster than for non-Indigenous students

Comparing suspension incident rate for Indigenous and non-Indigenous students attending Queensland state schools, 2013-2019. School Disciplinary Absences, Queensland Department of Education Open Data Portal These are our most vulnerable children. They need wrap-around support and a timely, educative response, not suspension or exclusion from school.
The 'school-to-prison pipeline'
Research from the United States has identified a similar racial bias in the use of exclusionary school discipline to Australia. African American students are up to four times as likely as their White peers to be referred to a school's office for“problem behaviour”. The research also states:
Multiple suspensions means spending a lot of time out of school . This is time that may be unsupervised, which can lead to injury and even death, gang affiliation, drug use, crime, increased police contact and entry to the criminal justice system .
Exclusionary school discipline is described as contributing to a phenomenon known as the“school-to-prison pipeline”. The majority of research on this topic has been conducted in the US.
Read more: Why suspending or expelling students often does more harm than good
To date, limited availability of data has prevented Australian researchers from investigating the local contours of this problem. Not only does this lack of data prevent public scrutiny and problem identification but it also leads to gaps in public policy.
For instance, the most recent analysis of progress against 17 agreed Closing the Gap targets found there has been no improvement in the school attendance rate of Indigenous students in the last ten years. Interestingly, the report does not mention the use of exclusionary school discipline. Nor does the 2020 Agreement on Closing the Gap include targets to reduce its use.
This appears a missed opportunity, given that two of 17 Closing the Gap targets are to reduce Indigenous overrepresentation in the criminal justice system.
Our research makes the case that we must, as a matter of urgency:
identify overrepresentation in school suspension and exclusion, and any patterns related to it challenge implicit bias, racism, and discrimination wherever they may exist develop culturally appropriate evidence-based prevention and intervention frameworks, as well as implement them on a system-wide basis. 
MENAFN14092021000199003603ID1102798513
Legal Disclaimer:
MENAFN provides the information “as is” without warranty of any kind. We do not accept any responsibility or liability for the accuracy, content, images, videos, licenses, completeness, legality, or reliability of the information contained in this article. If you have any complaints or copyright issues related to this article, kindly contact the provider above.