(MENAFN- DailyFX)
DOW JONES, NIKKEI 225, ASX 200 INDEX OUTLOOK:
- Dow Jones , S & P 500 and Nasdaq 100 closed +0.90%, +1.11%, and +1.61% respectively
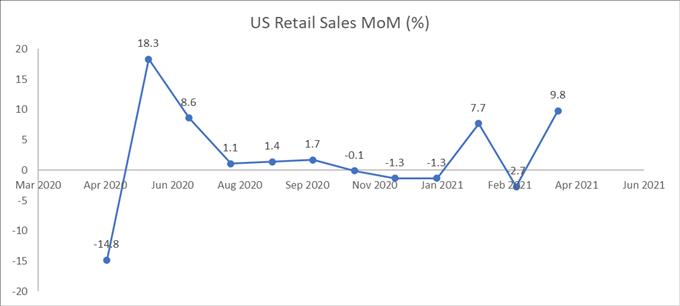
- US March retail sales jumped 9.8% MoM, propelled by stimulus checks and spending
- Futures across APAC gained while traders awaited Chinese GDP figure

US Retail Sales, Jobless Claims, China GDP, Asia-Pacific at Open:
Stocks on Wall Street rallied to their fresh records as investors cheered strong consumer spending after the release of March retail sales figure. The data came in at 9.8%, beating the baseline forecast of 5.9% by a wide margin. It suggests that President Joe Biden's fiscal stimulus is working to revitalize consumer demand as households start to spend the stimulus checks. Sporting goods, clothing and food and beverages led the gains in retail sales.
Meanwhile, weekly unemployment claims came lower than expected, further fueling investors' confidence about the recovery in the labor market. The Labor Department reported 576k new jobless claims for the week ending April 10, lower than a 700k forecast. The previous week's figure was revised slightly higher to 769k from 744k though. The overall picture reflected a faster pace of recovery in the job market as rapid vaccine rollouts and the latest fiscal spending boosted hiring activity.
US Retail Sales (MOM) Past 12 Months
Source: Bloomberg, DailyFX
Looking ahead, investors are eyeing Chinese Q1 GDP figure to be released at 2:00 GMT on Friday. The world's second-largest economy is expected to register a 19% YoY growth rate in the first quarter, which will mark the highest pace on record. This is largely attributed to a low base effect as part of the country was under lockdown in the first quarter of 2020 due to the Covid-19 outbreak. A higher-than-expected reading may set a positive tone for APAC trading today, although it may also strengthen the PBoC's neutral stance in setting the monetary policy and lead to a stronger Yuan. A weaker reading will likely do the reverse.
On the macro side, Chinese GDP, retail sales and industrial production figures headline the economic docket alongside Euro Area core inflation rate and the University of Michigan consumer sentiment index. Find out more from the DailyFX calendar .
China Q1 GDP Forecast

Source: Bloomberg, DailyFX
Asia-Pacific markets look set to open higher on Friday, with futures across Japan, Australia, Hong Kong, South Korea, Singapore, Malaysia and India in the green. Falling 10-year Treasury yields propelled gold prices , which climbed to a 7-week high. Crude oil prices also advanced as strong US data boosted the outlook for energy demand.
Australia's ASX 200 index oscillated between gains and losses at open as it seems to be challenging a key chart resistance. Japan's Nikkei 225 index advanced 0.42%, lifted by energy, materials and healthcare sectors.
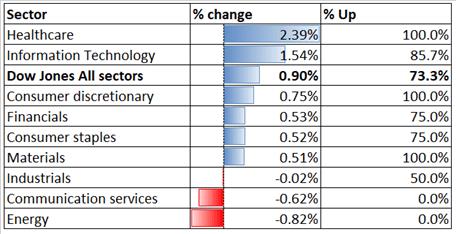
Looking back to Thursday's close, 6 out of 9 Dow Jones sectors ended higher, with 73.3% of the index's constituents closing in the green. healthcare (+2.39%), information technology (+1.54%) and consumer discretionary (+0.75%) were among the best performers, while energy (-0.82%) and communication services (-0.62%) lagged behind.
Dow Jones Sector Performance 15-04-2021
Source: Bloomberg, DailyFX

Dow Jones Index Technical Analysis
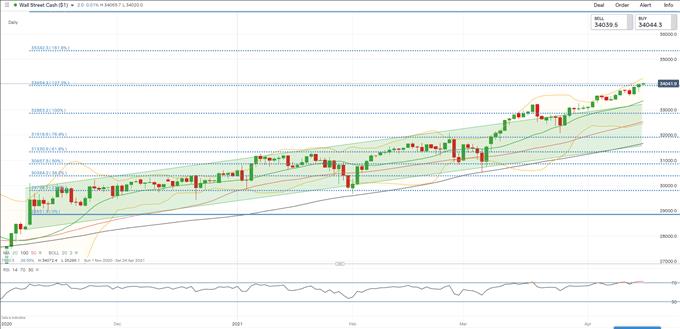
The Dow Jones index broke above the ceiling of the 'Ascending Channel and extended higher, underscoring strong upward momentum. The index is attempting to break an immediate resistance level at 33,954 - the 127.2% Fibonacci extension. A successful attempt would likely intensify near-term buying pressure and expose the next resistance level of 35,342 (the 161.8% Fibonacci extension). The RSI indicator breached above the overbought threshold of 70.0, suggesting that the index may be temporarily overstretched and further advancement may lead to a pullback.
Dow Jones Index Daily Chart
Nikkei 225 Index Technical Analysis:
The Nikkei 225 index failed to breach the 30,214 resistance (the 127.2% Fibonacci extension) for a third attempt, potentially forming a 'Triple Top chart pattern. Immediate support levels can be found at 29,523 (50-day SMA) and then 28,357 (100% Fibonacci extension). The MACD indicator is trending lower, suggesting that near-term momentum is tilted to the downside.
Nikkei 225 Index Daily Chart
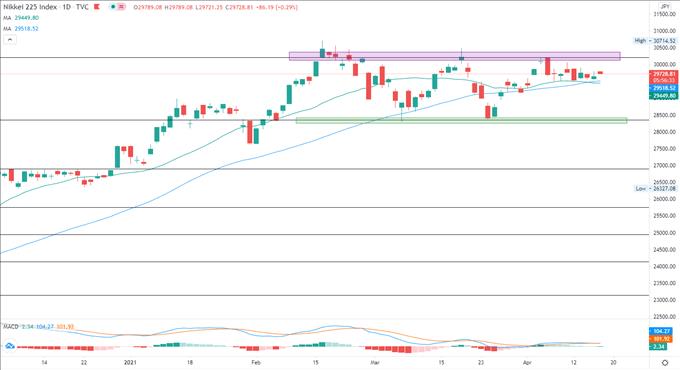
Chart by TradingView
ASX 200 Index Technical Analysis:
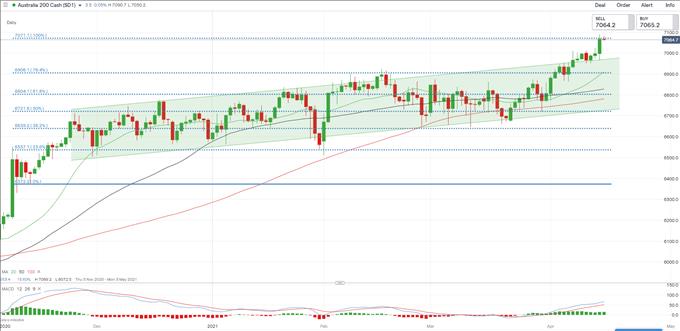
The ASX 200 index is challenging a key resistance level of 7,071 the 100% Fibonacci extension. A successful attempt may open the door to further gains with an eye on 7,260 the 127.2% Fibonacci extension. A failed attempt would lead to a pullback towards the ceiling of the 'Ascending Channel for support. The MACD indicator is trending higher above the neutral midpoint, underscoring upward momentum.
ASX 200 Index Daily Chart

--- Written by Margaret Yang, Strategist for DailyFX.com
To contact Margaret, use the Comments section below or @margaretyjy on Twitter
MENAFN15042021000076011015ID1101925159
Legal Disclaimer:
MENAFN provides the information “as is” without warranty of any kind. We do not accept any responsibility or liability for the accuracy, content, images, videos, licenses, completeness, legality, or reliability of the information contained in this article. If you have any complaints or copyright issues related to this article, kindly contact the provider above.