(MENAFN- DailyFX) 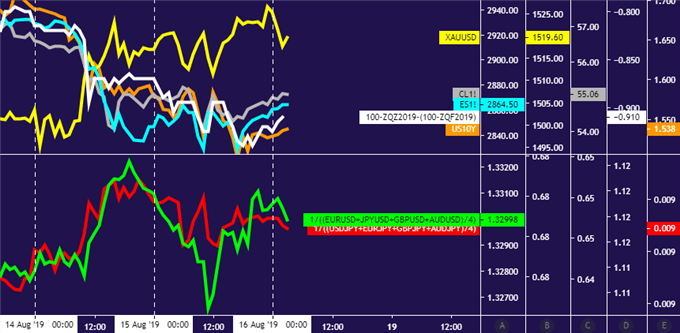
Crude oil,gold priceperformance chart created usingTradingView
GOLD & CRUDE OIL TALKING POINTS:Gold prices may rise as markets tilt risk-off before the weekend Crude oil pricesvulnerable, might move to retest $50/bbl figure Progress may be limited beforeFOMCminutes, Jackson Hole
Commodity prices idled Thursday as a lull in pace-setting news flow made room to digest recent volatility. From here, a relatively quiet offering on the economic data docket seems likely to keep broad-based market sentiment trends in control. The path of least resistance favors a risk-off scenario.
Sudden bursts of volatility have become increasingly common recently as prices react to eye-catching headlines from Washington and Beijing amid US-China trade war escalation. This probably has traders more leery than usual of holding pro-risk exposure over the weekend.
With that in mind, a round of defensive liquidation might pull down cycle-sensitive crude oil prices alongside stocks. A parallel dip in bond yields might have scope to push up gold, especially since the metal hasmanaged gains even as the US Dollar trades higherrecently.
Absent a burst of headline-driven volatility however, significant trend development seems unlikely. The week ahead brings critical inflection points in the Fed policy outlook – a defining macro input – by way of FOMC minutes and the Jackson Hole symposium. Commitment may be scarce in the interim.
Get our free guide to helpbuild confidence in your gold and crude oil trading strategy !
GOLD TECHNICAL ANALYSIS
Gold prices are inching toward resistance at 1540.70, the 76.4% Fibonacci expansion. A daily close above that exposes a weekly chart inflection level at 1563.00 next. Negative RSI divergence hints upside momentum is ebbing however. A turn below the 61.8% Fib at 1513.94 targets the 50% level at 1492.31.
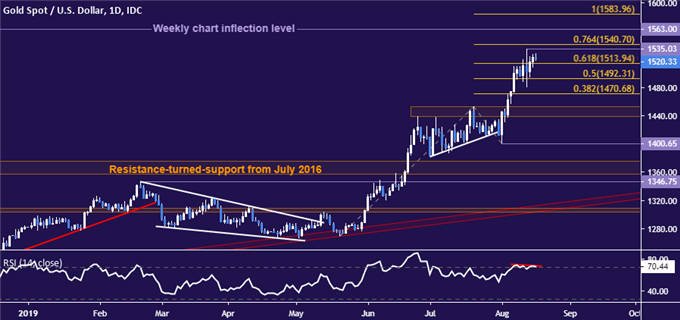
Gold price chart created usingTradingView
CRUDE OIL TECHNICAL ANALYSIS
Crude oil prices slipped back below the lower bound of the 54.72-56.09 congestion area, breaking the weekly uptrend in the process. Sellers may now move test the 49.41-50.60 zone anew. A daily close above trend resistance set from late April – now at 58.53 – seems necessary to neutralize downward pressure.
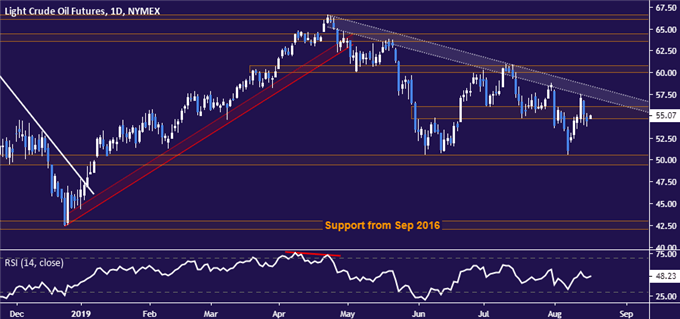
Crude oil price chart created usingTradingView
COMMODITY TRADING RESOURCESSee our guide to learn about thelong-term forces driving crude oil prices Having trouble with your strategy? Here's the#1 mistake that traders makeJoin a free webinarand have your commodity market questions answered
--- Written by Ilya Spivak, Currency Strategist for DailyFX.com
To contact Ilya, use the comments section below or@IlyaSpivakon Twitter
DailyFX
MENAFN1608201900760000ID1098888201
Legal Disclaimer:
MENAFN provides the information “as is” without warranty of any kind. We do not accept any responsibility or liability for the accuracy, content, images, videos, licenses, completeness, legality, or reliability of the information contained in this article. If you have any complaints or copyright issues related to this article, kindly contact the provider above.