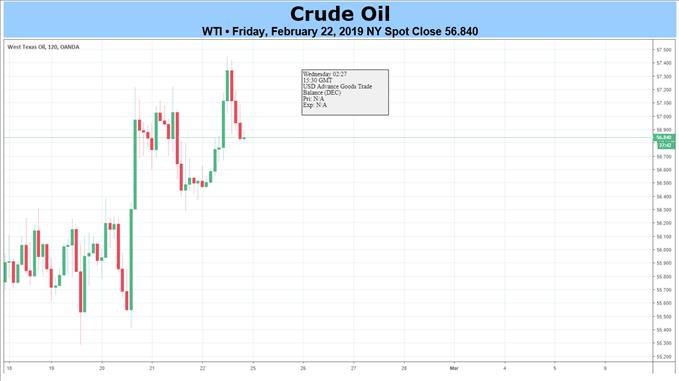
Crude Oil Prices Risk Overbought RSI Signal Despite Record U.S. Output
Fundamental Forecast for Crude Oil: Bullish
Crude Oil Talking Points Oil remains bid even though U.S. crude production climbs to a record high in February, and recent price action keeps the topside targets on the radar as the Relative Strength Index (RSI) flirts with overbought territory.Looking for a technical perspective on the Crude Oil? Check out the Weekly Crude Oil Technical Forecast .
It seems as though the rebalancing efforts by the Organization of the Petroleum Exporting Countries (OPEC) and allies will continue to bear fruit as crude take out the December-high ($54.55), and the ongoing adjust on the supply-side is likely to keep oil prices afloat as energy exports from Iran and Venezuela remain battered by the U.S. sanctions.It remains to be seen if OPEC and its allies will extend the six-month agreement at the next meeting in April amid the mixed rhetoric coming out of Russia , but the current environment may foster a larger correction in crude prices amid the tepid pace of growth in non-OPEC production.
Fresh updates from the U.S. Energy Information (EIA) show U.S. crudeweekly field output climbing to a record 20,000K b/d in the week ending February 15 after holding steady at 11,900K b/d for the past four consecutive weeks. A further uptick in U.S. output may become a growing concern for OPEC and its allies, but so far, the figures indicate a limited threat of non-OPEC supply, with signs of stagnant U.S. supply likely to instill a constructive outlook for crude especially as an inverse head-and-shoulders formation appears to be taking shape.
At the same time, recent developments in the Relative Strength Index (RSI) suggest the bullish momentum may gather pace as the indicator flirts with overbought territory, with a break above 70 raising the risk for higher oil prices as the oscillator continues to track the upward trend carried over from late-2018. Sign up and join DailyFX Currency Analyst David Song LIVE for an opportunity to discuss potential trade setups!CL1 Daily Chart
Keep in mind, the broader outlook for crude remains constructive following the break of the December-high ($54.55), with a break/close above $57.40 (61.8% retracement) opening up the Fibonacci overlap around $59.00 (61.8% retracement) to $59.70 (50% retracement). Next region of interests comes in around $62.70 (61.8% retracement) to $63.70 (38.2% retracement) followed by the overlap around $64.90 (100% expansion) to $65.90 (78.6% retracement).However, failure to close above $57.40 (61.8% retracement) may generate a near-term pullback especially if the RSI fails to push into overbought territory, with the first region of interest coming in around $55.10 (61.8% expansion) to $55.60 (61.8% retracement) followed by $51.40 (50% retracement) to $52.10 (50% expansion).
Additional Trading Resources Are you looking to improve your trading approach? Review the ‘ Traits of a Successful Trader ' series on how to effectively use leverage along with other best practices that any trader can follow.
Want to know what other markets the DailyFX team is watching? Download and review the Top Trading Opportunities for 2019--- Written by David Song, Currency Analyst
Follow me on Twitter at @DavidJSong.
Other Weekly Fundamental Forecasts: Australian Dollar Forecast Australian Dollar Market May be Calmer, But Watch Trade Headlines
DailyFX

Legal Disclaimer:
MENAFN provides the
information “as is” without warranty of any kind. We do not accept
any responsibility or liability for the accuracy, content, images,
videos, licenses, completeness, legality, or reliability of the information
contained in this article. If you have any complaints or copyright
issues related to this article, kindly contact the provider above.


Comments
No comment