403
Sorry!!
Error! We're sorry, but the page you were looking for doesn't exist.
BTC/USD Forex Signal 25/11: Rebounds Amid Dip Buying (Chart)
(MENAFN- Daily Forex) Bullish view
- Buy the BTC/USD pair and set a take-profit at 91,000. Add a stop-loss at 84,000. Timeline: 1-2 days.
- Sell the BTC/USD pair and set a take-profit at 84,000. Add a stop-loss at 91,000.
Looking ahead, the Bitcoin price will react mildly to the upcoming macro data from the United States, including the housing price index and the consumer confidence report by the Conference Board.
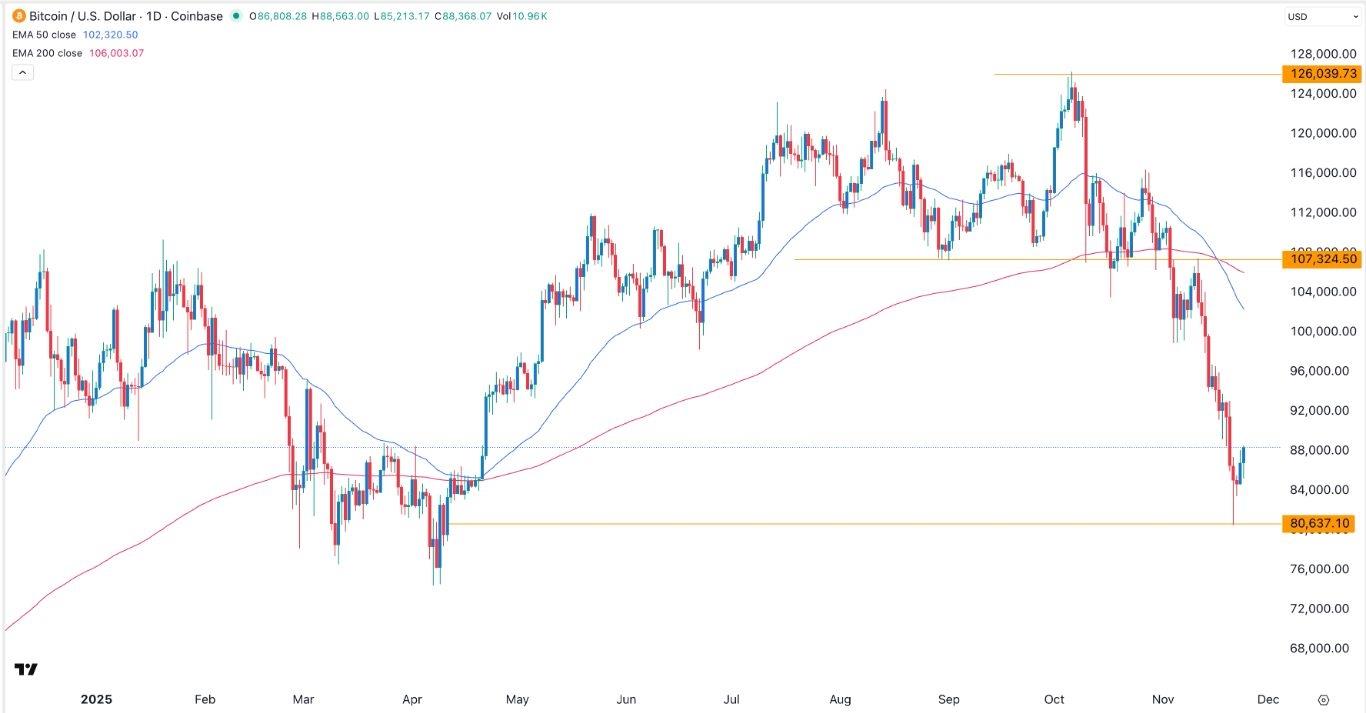
EURUSD Chart by TradingViewBTC/USD Technical AnalysisThe daily timeframe chart shows that the BTC/USD pair has been in a strong downward trend in the past few weeks, moving from the all-time high of 126,200 in October to the current 88,400.Bitcoin has now rebounded after forming a hammer candlestick pattern, which is made up of a long lower shadow and a small body. This pattern is one of the most common bullish reversal sign.Therefore, the pair will likely continue rising as bulls target the next key resistance level at 90,000. A move above that level will point to more gains as investors continue buying the dip. However, there is a likelihood that the BTC/USD pair will retreat and retest the key support level at 80,637, its lowest level this month.Ready to trade our free daily Forex trading signals? We've shortlisted the best MT4 crypto brokers in the industry for you.
Legal Disclaimer:
MENAFN provides the
information “as is” without warranty of any kind. We do not accept
any responsibility or liability for the accuracy, content, images,
videos, licenses, completeness, legality, or reliability of the information
contained in this article. If you have any complaints or copyright
issues related to this article, kindly contact the provider above.


Comments
No comment