403
Sorry!!
Error! We're sorry, but the page you were looking for doesn't exist.
Nasdaq 100 Analysis 25/11: Holds Above Ichimoku (Chart)
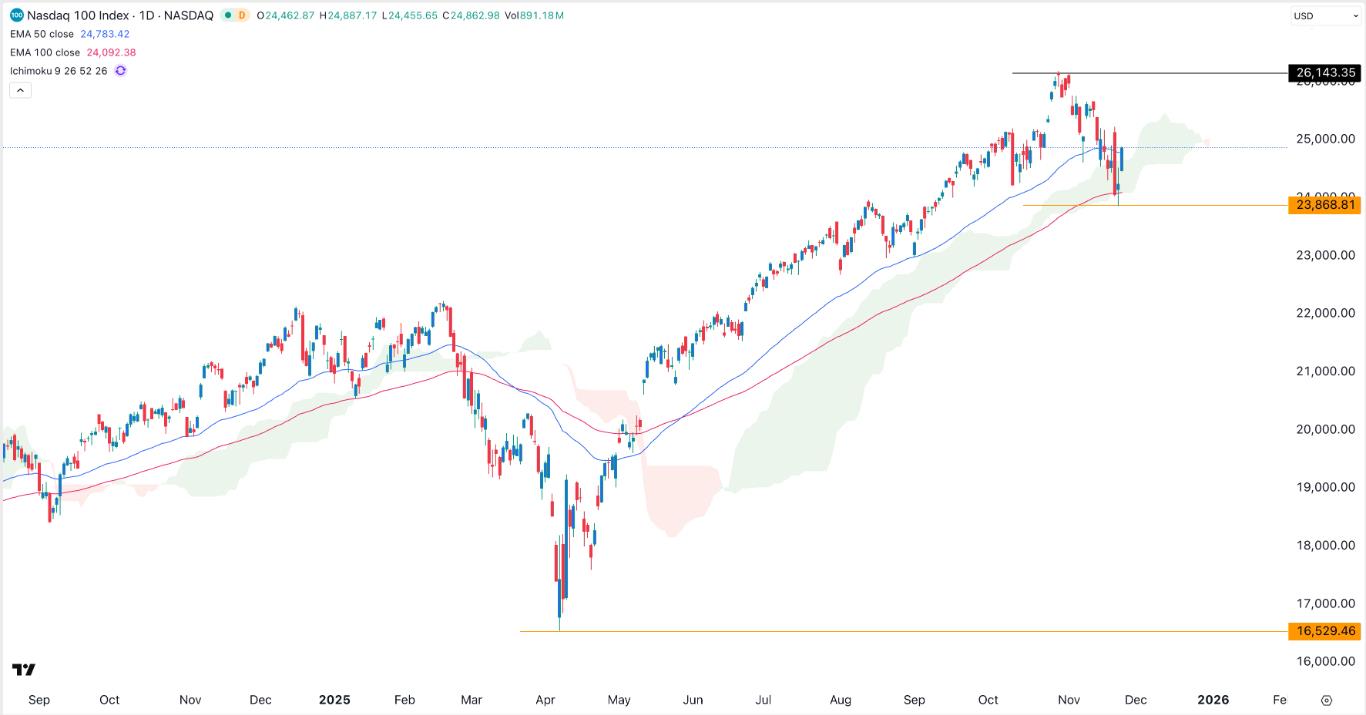
(MENAFN- Daily Forex) The Nasdaq 100 Index jumped as investors piled back into technology stocks after a relatively dovish statement from a senior Federal Reserve official, who is among those aiming to replace Jerome Powell. It jumped to $24,840, up sharply from last week's low of $23,830.Top Technology Earnings AheadThe Nasdaq 100 Index jumped after Christopher Waller, a top Federal Reserve official, maintained that he supported another interest rate cut in the December meeting, mirroring John Williams statement on Friday.Waller, who is one of the candidates shortlisted to replace Powell, has long maintained that interest rates were significantly higher than ideal as that labor market was showing some cracks, with the unemployment rate rising gradually.The index also jumped as Tesla, one of its top constituent companies surged after Elon Musk revealed that it had built its AI chip. While Tesla's sales have slowed, investors believe that the company will succeed because of its self-driving technology.Top Forex Brokers1 Get Started 74% of retail CFD accounts lose money AI companies were the biggest gainers on Monday, with Broadcom jumping by 10%, bringing its market capitalization to over $1.7 trillion. Other companies like Micron, Marvell, Palantir, AppLovin, and Alphabet were among the top gainers on Monday.Looking ahead, the Nasdaq 100 Index will react to some important technology company earnings scheduled for the next two days. Analog Devices, Dell, Autodesk, Workday, Zscaler, and NetApp will publish their financial later today, Nov..25. These results will provide more color on whether the AI industry is still doing well.
Chances are that these companies will publish strong results as data compiled by FactSet shows that most companies published better-than-expected results, with the average earnings growth being 13.5%.
EURUSD Chart by TradingViewNasdaq 100 Index Technical AnalysisThe daily timeframe chart shows that the Nasdaq 100 Index has rebounded from this month's low of $23,868 to nearly $25,000.It has moved above the 50-day and 100-day Exponential Moving Averages (EMA), a sign that conditions are improving.The index has remained above the Ichimoku cloud indicator, which is a positive sign. There are signs that it is slowly forming a double-top pattern whose upper side is at its all-time high of $26,143 and its neckline is at $23,868.While a double-top is a risky pattern, it means that may rebound by about 5% to hit that level. However, a drop below the support at $23,868 will invalidate the bullish Nasdaq 100 Index forecast.Ready to trade our stock market forecast and analysis? Here are the best CFD stocks brokers to choose from.
Legal Disclaimer:
MENAFN provides the
information “as is” without warranty of any kind. We do not accept
any responsibility or liability for the accuracy, content, images,
videos, licenses, completeness, legality, or reliability of the information
contained in this article. If you have any complaints or copyright
issues related to this article, kindly contact the provider above.


Comments
No comment