403
Sorry!!
Error! We're sorry, but the page you were looking for doesn't exist.
S&P 500 Analysis 25/11: AI Stocks Stage A Comeback (Chart)
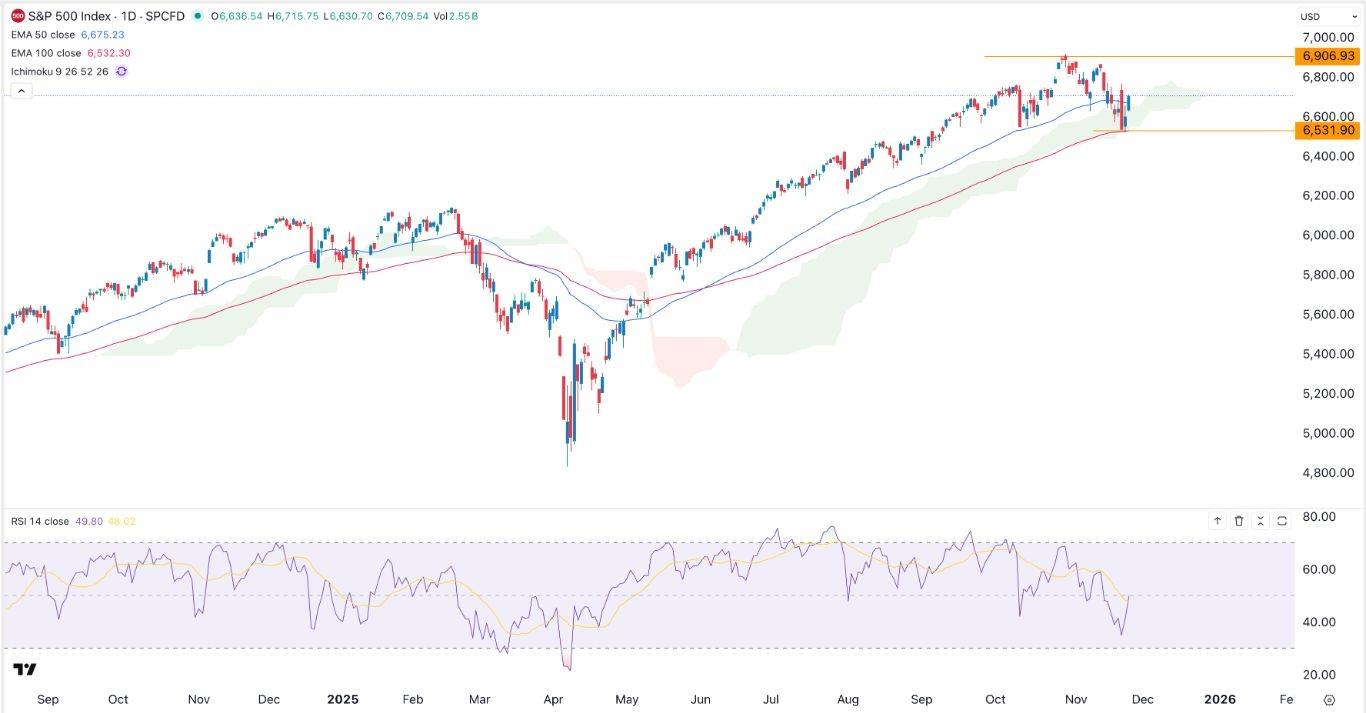
(MENAFN- Daily Forex) The S&P 500 Index rose for two consecutive days, erasing some of the losses made last week when it plunged after the Nvidia earnings. It jumped to $6,706, up from this month's low of $6,530.US Stocks Jumps as the AI Boom ContinuesThe S&P 500 Index continued its recovery as companies in the artificial intelligence industry continued to lead. Broadcom, one of the top players in the AI sector, surged by 11%, bringing its market capitalization to over $1.77 trillion.Western Digital, which makes hard drives and solid state drives, jumped by 9% on hopes that its sales to data center companies will continue rising.The other top gainers on Monday will be companies like Seagate, which, like Western Digital, makes hard drives, Robinhood, Coinbase, Tesla, Palantir, and Alphabet. All these stocks jumped by over 7%., erasing some of the losses made last week.On the other hand, companies like Carnival, Royal Caribbean, Paramount, and Live Nation were the top laggards in the S&P 500 Index as investors rotated from value to growth.The S&P 500 Index jumped after Christopher Waller, a top Fed official, maintained his view that the Fed needed to cut interest rates in the December meeting now that there are cracks in the labor market. Last week's report by the Bureau of Labor Statistics showed that the country's unemployment rate rose to 4.4% in September.Top Forex Brokers1 Get Started 74% of retail CFD accounts lose money Odds of Federal Reserve interest rate cuts jumped on Polymarket and Kalshi as the US bond yields continued falling. The 10-year yield dropped to 4.038%, while the 30-year and two-year fell to 4.68% and 3.5%, respectively.Looking ahead, as the earnings season wraps up, some key companies like Dell, HP, Autodesk, and Deer will publish their quarterly results.S&P 500 Index Technical AnalysisThe daily timeframe chart shows that the S&P 500 Index bottomed at $6,530 on November 20th and then rebounded to the current $6,700. Its lowest level last week was notable as it coincided with the 100-day Exponential Moving Average.The index has now moved slightly above the 50-day EMA, a sign that bulls are in control for now. It also moved above the Ichimoku cloud indicator, while the Relative Strength Index rebounded and is pointing upwards.Therefore, the index will likely continue rising as bulls target the next key resistance level at $6,900, its all-time high.Ready to trade our stock market forecast and analysis? Here are the best CFD stocks brokers to choose from.

Legal Disclaimer:
MENAFN provides the
information “as is” without warranty of any kind. We do not accept
any responsibility or liability for the accuracy, content, images,
videos, licenses, completeness, legality, or reliability of the information
contained in this article. If you have any complaints or copyright
issues related to this article, kindly contact the provider above.


Comments
No comment