403
Sorry!!
Error! We're sorry, but the page you were looking for doesn't exist.
BTC/USD Signal Today 10/4: Gains Are Nothing Special (Chart)
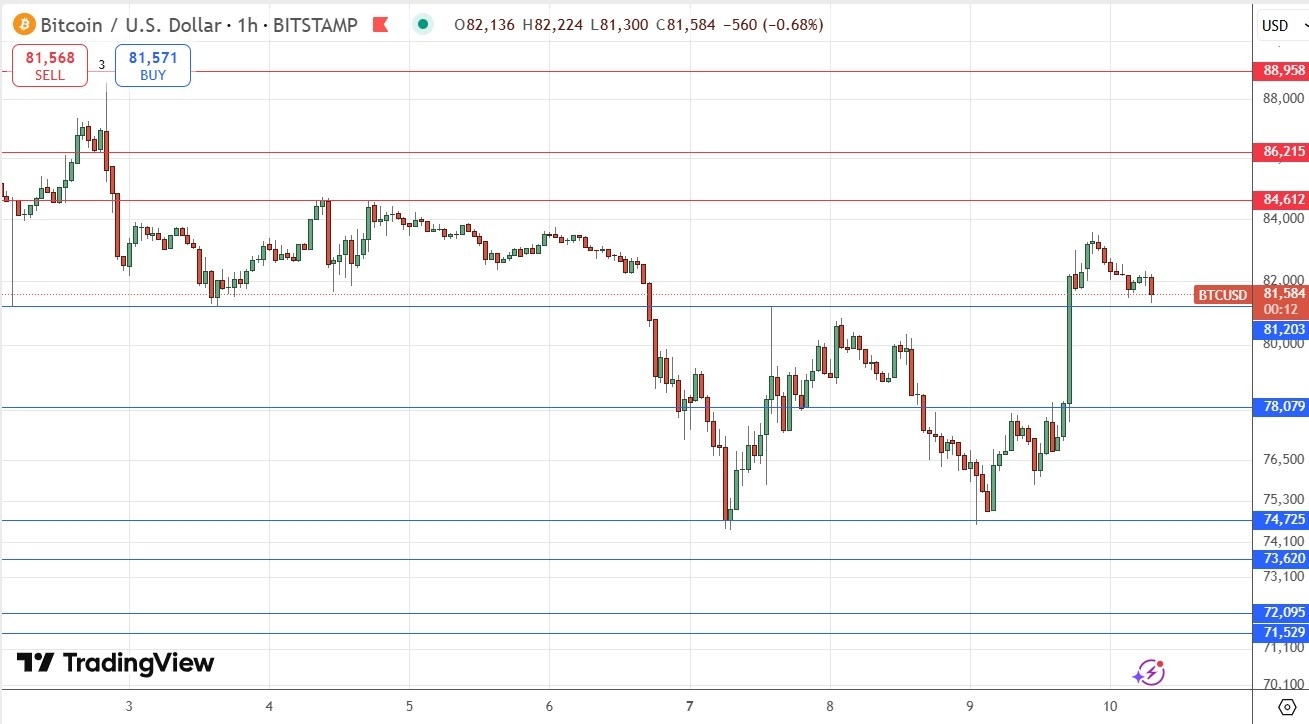
(MENAFN- Daily Forex) My previous BTC/USD signal on 7th April produced a losing short trade from the bearish reversal at the resistance level of $79,599. Today's BTC/USD SignalsRisk 0.50% per trade.Trades may only be taken before 5pm Tokyo time Friday.Top Forex Brokers1 Get Started 74% of retail CFD accounts lose money Long Trade Ideas
- Long entry after a bullish price action reversal on the H1 timeframe following the next touch of $81,203, $78,079, or $74,725. Place the stop loss $100 below the local swing low. Adjust the stop loss to break even once the trade is $100 in profit by price. Remove 50% of the position as profit when the trade is $100 in profit by price and leave the remainder of the position to ride.
- Short entry after a bearish price action reversal on the H1 timeframe following the next touch of $84,807, $86,215, or $88,958. Place the stop loss $100 above the local swing high. Adjust the stop loss to break even once the trade is $100 in profit by price. Remove 50% of the position as profit when the trade is $100 in profit by price and leave the remainder of the position to ride.
A short trade from $84,612 following a bearish reversal there could also be a good trade.
EURUSD Chart by TradingViewThere is nothing of high importance due today regarding Bitcoin. Concerning the US Dollar, there will be a release of CPI (inflation) and Unemployment Claims data at 1:30pm London time.Ready to trade our daily Forex signals on Bitcoin? Here's our list of the best MT4 crypto brokers worth reviewing.
Legal Disclaimer:
MENAFN provides the
information “as is” without warranty of any kind. We do not accept
any responsibility or liability for the accuracy, content, images,
videos, licenses, completeness, legality, or reliability of the information
contained in this article. If you have any complaints or copyright
issues related to this article, kindly contact the provider above.


Comments
No comment