


403
Sorry!!
Error! We're sorry, but the page you were
looking for doesn't exist.

ACE HARDWARE REPORTS SECOND QUARTER 2024 RESULTS
(MENAFN- PR Newswire)
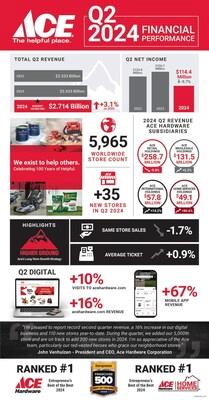
Ace Hardware Q2 2024 Earnings Infographic
- Record second quarter revenues of $2.7 billion, an increase of 3.1 percent
- Online sales increased 16 percent
- Second quarter net income of $114.4 million, a decrease of 9.7 percent
- Delivered twelfth consecutive month of cost reductions to Ace store owners
- Accrued patronage dividend to shareholders of $109.3 million, a decrease of 6.3 percent from the second quarter of 2023
- Ace reaches 5,000 U.S. locations; will add 200 new stores in 2024
OAK BROOK, Ill., Aug. 21, 2024 /PRNewswire/ -- Ace Hardware Corporation ("Ace" or the "Company") today reported second quarter 2024 revenues of $2.7 billion, an increase of $81.7 million, or 3.1 percent, from the second quarter of 2023.
Net income was $114.4 million for the second quarter of 2024, a decrease of $12.3 million from the second quarter of 2023.
This decrease was due to planned increases in marketing expenses and retail store expenses.
The increased spending was expected to be offset by an improved gross margin rate.
However, product cost deflation and higher transportation costs prevented the margin expansion.
Ace Hardware Q2 2024 Earnings Infographic
"I'm pleased to report record second quarter revenue, a 16% increase in our digital business and 110 new stores year-to-date," said John Venhuizen, Ace President & CEO. "During the quarter, we added our 5,000th store and are on track to add 200 new stores in 2024.
I'm so appreciative of the Ace team, particularly our red-vested heroes who grace our neighborhood stores."
The approximately 3,800 Ace retailers who share daily retail sales data reported a 1.7 percent decrease in U.S. retail same-store-sales during the second quarter of 2024, which was the result of a 2.6 percent decrease in same-store transactions; partially offset by a 0.9 percent increase in average ticket.
Revenues
Consolidated revenues for the quarter ended June 29, 2024 totaled $2.7 billion.
Total wholesale revenues were $2.5 billion, an increase of $83.7 million, or 3.5 percent, as compared to the prior year second quarter.
Increases were seen across many departments with outdoor power equipment, power tools, lawn and garden and grilling showing the largest gains.
Wholesale merchandise revenues to new domestic stores activated from January 2023 through June 2024 contributed $68.9 million of incremental revenues during the second quarter of 2024, while wholesale merchandise revenues decreased $7.4 million during the second quarter due to domestic stores whose memberships were cancelled.
Wholesale merchandise revenues to comparable domestic stores decreased $41.8 million for the quarter.
The Company's Ace International Holdings, Ltd. subsidiary experienced a $7.1 million increase in wholesale revenue versus the second quarter of 2023, while Ace Wholesale Holdings LLC reported a $2.7 million increase in wholesale revenues from the second quarter of 2023.
The Company's Ace Services Holdings LLC ("ASH") subsidiary, which is reported as part of the Company's wholesale business, experienced a $22.8 million increase in wholesale revenues from the second quarter of 2023.
This is due to the inclusion of revenues of Unique Indoor Comfort Holdings, LLC ("UICH") for the full second quarter of 2024.
UICH was acquired on April 12, 2023, so the prior year did not include a full quarter of revenue.
Total retail revenues from Ace Retail Holdings LLC ("ARH") for the quarter were $258.7 million, a decrease of $2.0 million, or 0.8 percent, as compared to the prior year second quarter.
The Westlake Ace Hardware ("Westlake") chain experienced a 4.6 percent decrease in same-store-sales, while the Great Lakes Ace Hardware ("GLA") chain experienced a 0.4 percent decrease in same-store-sales in the quarter.
The new stores opened by Westlake and GLA since the end of the first quarter of 2023 contributed $7.5 million of incremental revenues during the second quarter of 2024.
Westlake and GLA together operated 240 stores at the end of the second quarter of 2024 compared to 231 stores at the end of the second quarter of 2023.
The Company's total domestic store count was 5,084 at the end of the second quarter of 2024, which was an increase of 160 stores from the second quarter of 2023.
The worldwide store count was 5,965 at the end of the second quarter of 2024.
Gross Profit
Wholesale gross profit for the three months ended June 29, 2024 was $335.6 million, an increase of $12.0 million from the second quarter of 2023.
The wholesale gross margin percentage was 13.7 percent of wholesale revenues in the second quarter of 2024, up slightly from 13.6 percent in the second quarter of 2023.
Retail gross profit for the three months ended June 29, 2024 was $111.8 million, a decrease of $0.8 million from the second quarter of 2023.
The retail gross margin percentage was unchanged at 43.2 percent of retail revenues in both the second quarter of 2024 and 2023.
For ARH, retail gross profit is based on the Company's wholesale acquisition cost of product, not ARH's acquisition cost, which includes a markup from the Company.
Expenses and Other
Wholesale operating expenses increased $28.2 million, or 12.6 percent, from the second quarter of 2023.
The increase is primarily due to increased advertising expenses and the acquisition of UICH, which added $8.3 million of incremental operating expenses.
Wholesale operating expenses as a percent of wholesale revenue was 10.3 percent, up from 9.4 percent in the second quarter of 2023.
Retail operating expenses increased $4.3 million, or 6.1 percent, from the second quarter of 2023.
This increase was primarily driven by expenses incurred related to the new stores added since the end of the first quarter of 2023.
Retail operating expenses as a percent of retail revenue increased to 29.0 percent in the second quarter of 2024 from 27.1 percent in the second quarter of 2023.
Other income (expense), net increased $9.3 million primarily due to the absence of UICH acquisition fees recognized in the second quarter of 2023, coupled with a partial insurance recovery related to the cybersecurity incident that took place during the fourth quarter of 2023.
Balance Sheet and Cash Flow
Receivables increased $67.6 million from the second quarter of 2023 due to higher sales volumes and increased vendor rebates receivable.
Inventories decreased $63.3 million from the second quarter of 2023 primarily as a result of efforts to reduce overstock inventory.
Long-term debt, including current maturities, increased $7.9 million versus the second quarter of 2023.
At the end of the second quarter of 2024, long-term debt consisted of $260.9 million outstanding on the revolving credit facility, $30.2 million outstanding on the Westlake credit facility, and $46.7 million owed to former retailers.
About Ace Hardware
Ace Hardware is the largest retailer-owned hardware cooperative in the world with over 5,900 locally owned and operated hardware stores in approximately 60 countries. Headquartered in Oak Brook, Ill., Ace and its subsidiaries operate an expansive network of distribution centers in the U.S. and have distribution capabilities in Ningbo, China; and Cuautitlán Izcalli, Mexico.
Since 1924, Ace has been a part of local communities around the world and known as the place with the helpful hardware folks. For more information, visit acehardware or href="" rel="nofollow" acehardwar .
Contacts:
Shareholders'/Investors' Inquiries:
William Guzik, Executive Vice President, Chief Financial Officer & Chief Risk Officer
630-990-3325, [email protected]
Media Inquiries:
Jeff Gooding, Vice President, Consumer Marketing
630-990-3600, [email protected]
| ACE HARDWARE CORPORATION CONSOLIDATED STATEMENTS OF INCOME (Unaudited, in millions) |
|
|||||||
| |
|
|||||||
| |
Three Months Ended |
|
Six Months Ended |
|
|
|||
| |
June 29, |
|
July 1, |
|
June 29, |
|
July 1, |
|
| |
2024 |
|
2023 |
|
2024 |
|
2023 |
|
| |
(13 Weeks) |
|
(13 Weeks) |
|
(26 Weeks) |
|
(26 Weeks) |
|
| |
|
|
|
|
|
|
|
|
| Revenues: |
|
|
|
|
|
|
|
|
| Wholesale revenues |
$ |
|
$ |
|
$ |
|
$ |
|
| Retail revenues |
258.7 |
|
260.7 |
|
419.6 |
|
408.9 |
|
| Total revenues |
2,714.3 |
|
2,632.6 |
|
4,852.1 |
|
4,718.8 |
|
| Cost of revenues: |
|
|
|
|
|
|
|
|
| Wholesale cost of revenues |
2,120.0 |
|
2,048.3 |
|
3,842.6 |
|
3,733.7 |
|
| Retail cost of revenues |
146.9 |
|
148.1 |
|
232.1 |
|
226.3 |
|
| Total cost of revenues |
2,266.9 |
|
2,196.4 |
|
4,074.7 |
|
3,960.0 |
|
| Gross profit: |
|
|
|
|
|
|
|
|
| Wholesale gross profit |
335.6 |
|
323.6 |
|
589.9 |
|
576.2 |
|
| Retail gross profit |
111.8 |
|
112.6 |
|
187.5 |
|
182.6 |
|
| Total gross profit |
447.4 |
|
436.2 |
|
777.4 |
|
758.8 |
|
| |
|
|
|
|
|
|
|
|
| Wholesale operating expenses: |
|
|
|
|
|
|
|
|
| Distribution operations expenses |
71.5 |
|
70.6 |
|
140.4 |
|
137.1 |
|
| Selling, general and administrative expenses |
83.7 |
|
72.4 |
|
167.8 |
|
139.6 |
|
| Retailer success and development expenses |
96.5 |
|
80.5 |
|
146.1 |
|
124.7 |
|
| Retail operating expenses |
75.0 |
|
70.7 |
|
146.7 |
|
140.9 |
|
| Retail pre-opening expenses |
2.1 |
|
1.0 |
|
2.7 |
|
2.4 |
|
| Total operating expenses |
328.8 |
|
295.2 |
|
603.7 |
|
544.7 |
|
| Operating income |
118.6 |
|
141.0 |
|
173.7 |
|
214.1 |
|
| |
|
|
|
|
|
|
|
|
| Interest expense |
(12.1) |
|
(10.8) |
|
(24.3) |
|
(17.1) |
|
| Interest income |
1.4 |
|
1.0 |
|
3.3 |
|
2.3 |
|
| Other income (expense), net |
6.1 |
|
(3.2) |
|
8.3 |
|
(2.5) |
|
| Income tax benefit (expense) |
0.4 |
|
(1.3) |
|
0.3 |
|
(3.9) |
|
| Net income |
114.4 |
|
126.7 |
|
161.3 |
|
192.9 |
|
| Less: net loss attributable to noncontrolling interests |
(0.4) |
|
(0.2) |
|
(0.7) |
|
(0.6) |
|
| Net income attributable to Ace Hardware Corporation |
$ |
|
$ |
|
$ |
|
$ |
|
| Patronage distributions accrued |
$ |
|
$ |
|
$ |
|
$ |
|
| Patronage distributions accrued for third party Retailers |
$ |
|
$ |
|
$ |
|
$ |
|
| ACE HARDWARE CORPORATION CONSOLIDATED BALANCE SHEETS (In millions, except share data) |
|||||
| |
|||||
| |
June 29, |
|
December 30, |
|
July 1, |
| |
2024 |
|
2023 |
|
2023 |
| Assets |
(Unaudited) |
|
(Audited) |
|
(Unaudited) |
| Cash and cash equivalents |
$ |
|
$ |
|
$ |
| Marketable securities |
51.2 |
|
49.4 |
|
52.1 |
| Receivables, net of allowance for doubtful accounts of $12.5, $12.1 and $9.0, respectively |
913.5 |
|
674.4 |
|
845.9 |
| Inventories |
1,313.1 |
|
1,235.1 |
|
1,376.4 |
| Prepaid expenses and other current assets |
79.7 |
|
69.9 |
|
60.1 |
| Total current assets |
2,397.5 |
|
2,060.7 |
|
2,385.1 |
| Property and equipment, net |
568.7 |
|
541.0 |
|
510.8 |
| Operating lease right-of-use assets, net |
801.0 |
|
668.0 |
|
669.9 |
| Finance lease right-of-use assets, net |
120.3 |
|
123.9 |
|
120.4 |
| Goodwill and other intangible assets, net |
430.3 |
|
410.9 |
|
405.7 |
| Other assets |
172.1 |
|
153.1 |
|
153.4 |
| Total assets |
$ |
|
$ |
|
$ |
| |
|
|
|
|
|
| Liabilities and Equity |
|
|
|
|
|
| Current maturities of long-term debt |
$ |
|
$ |
|
$ |
| Accounts payable |
1,589.1 |
|
1,081.5 |
|
1,598.6 |
| Patronage distributions payable in cash |
71.9 |
|
137.1 |
|
80.3 |
| Patronage refund certificates payable |
29.0 |
|
29.1 |
|
23.0 |
| Current operating lease liabilities |
88.6 |
|
88.5 |
|
73.7 |
| Current finance lease liabilities |
27.5 |
|
25.6 |
|
21.4 |
| Accrued expenses |
275.9 |
|
292.0 |
|
221.4 |
| Total current liabilities |
2,131.2 |
|
1,702.9 |
|
2,037.0 |
| Long-term debt |
288.6 |
|
359.2 |
|
311.3 |
| Patronage refund certificates payable |
182.7 |
|
149.6 |
|
134.5 |
| Long-term operating lease liabilities |
730.4 |
|
603.2 |
|
621.2 |
| Long-term finance lease liabilities |
94.8 |
|
100.4 |
|
98.3 |
| Other long-term liabilities |
138.7 |
|
120.9 |
|
112.0 |
| Total liabilities |
3,566.4 |
|
3,036.2 |
|
3,314.3 |
| Member Retailers' Equity: |
|
|
|
|
|
| Class A voting common stock, $1,000 par value, 10,000 shares authorized, 2,607, 2,615 and 2,649 issued and outstanding, respectively |
2.6 |
|
2.6 |
|
2.7 |
| Class C nonvoting common stock, $100 par value, 20,000,000 shares authorized, 7,832,140, 7,226,176 and 7,420,294 issued and |
783.2 |
|
722.6 |
|
742.0 |
| Class C nonvoting common stock, $100 par value, issuable to retailers for patronage distributions, 464,990, 897,317 and 706,506 shares |
46.5 |
|
89.7 |
|
70.7 |
| Contributed capital |
19.1 |
|
19.2 |
|
19.1 |
| Retained earnings |
65.2 |
|
78.2 |
|
85.9 |
| Accumulated other comprehensive (loss) income |
(0.9) |
|
0.3 |
|
(0.2) |
| Equity attributable to Ace member retailers |
915.7 |
|
912.6 |
|
920.2 |
| Equity attributable to noncontrolling interests |
7.8 |
|
8.8 |
|
10.8 |
| Total equity |
923.5 |
|
921.4 |
|
931.0 |
| Total liabilities and equity |
$ |
|
$ |
|
$ |
| ACE HARDWARE CORPORATION CONSOLIDATED STATEMENTS OF CASH FLOWS (Unaudited, in millions) |
|||
| |
|||
| |
Six Months Ended |
||
| |
June 29, |
|
July 1, |
| |
2024 |
|
2023 |
| |
(26 Weeks) |
|
(26 Weeks) |
| Operating Activities |
|
|
|
| Net income |
$ |
|
$ |
| Adjustments to reconcile net income to net cash provided by operating activities: |
|
|
|
| Depreciation and amortization |
48.5 |
|
42.4 |
| Non cash lease expense |
14.9 |
|
12.7 |
| Amortization of deferred financing costs |
0.5 |
|
0.8 |
| Loss on the disposal of assets, net |
0.4 |
|
3.1 |
| Provision for doubtful accounts |
0.9 |
|
3.1 |
| Other, net |
(6.0) |
|
1.7 |
| Changes in operating assets and liabilities, exclusive of effects of acquisitions: |
|
|
|
|
|
(266.8) |
|
(215.6) |
| Inventories |
(75.2) |
|
(66.1) |
| Other current assets |
(9.9) |
|
1.3 |
| Other long-term assets |
(12.8) |
|
(11.3) |
| Accounts payable and accrued expenses |
516.9 |
|
361.7 |
| Other long-term liabilities |
14.4 |
|
5.0 |
| Deferred taxes |
(1.0) |
|
(0.5) |
| Net cash provided by operating activities |
386.1 |
|
331.2 |
| Investing Activities |
|
|
|
|
|
(16.9) |
|
(25.7) |
| Proceeds from sale of investment securities |
14.5 |
|
26.6 |
| Purchases of property and equipment |
(76.7) |
|
(77.7) |
| Cash paid for acquired businesses, net of cash acquired |
(18.6) |
|
(306.0) |
| Increase in notes receivable, net |
(18.2) |
|
(12.9) |
| Proceeds from sale of assets |
0.6 |
|
0.1 |
| Other, net |
0.1 |
|
(0.3) |
| Net cash used in investing activities |
(115.2) |
|
(395.9) |
| Financing Activities |
|
|
|
|
|
(70.8) |
|
280.0 |
| Principal payments on long-term debt |
(9.4) |
|
(7.3) |
| Payments of debt issuance costs |
- |
|
(4.4) |
| Principal portion of finance lease payments |
(16.7) |
|
(15.3) |
| Payments of cash portion of patronage distribution |
(137.1) |
|
(133.1) |
| Payments of patronage refund certificates |
(22.8) |
|
(26.7) |
| Repurchase of stock |
(6.2) |
|
(6.6) |
| Purchase of noncontrolling interests |
(0.5) |
|
(0.3) |
| Other, net |
0.7 |
|
0.5 |
| Net cash (used in) provided by financing activities |
(262.8) |
|
86.8 |
| Increase in cash and cash equivalents |
8.1 |
|
22.1 |
| Cash and cash equivalents at beginning of period |
31.9 |
|
28.5 |
| Cash and cash equivalents at end of period |
$ |
|
$ |
| |
|
|
|
| Supplemental disclosure of cash flow information: |
|
|
|
|
|
$ |
|
$ |
|
|
$ |
|
$ |
SOURCE Ace Hardware Corporation

Legal Disclaimer:
MENAFN provides the information “as is” without warranty of any kind. We do not accept any responsibility or liability for the accuracy, content, images, videos, licenses, completeness, legality, or reliability of the information contained in this article. If you have any complaints or copyright issues related to this article, kindly contact the provider above.
Most popular stories
More Story


Comments
No comment