(MENAFN- DailyFX)
USD Technical Outlook
- US Dollar Index (DXY) trend remains decisively lower
- Short-term levels to keep an eye on for helping shape trading bias
Advertisement US Dollar Technical Analysis: Levels and Lines to Watch in Days Ahead
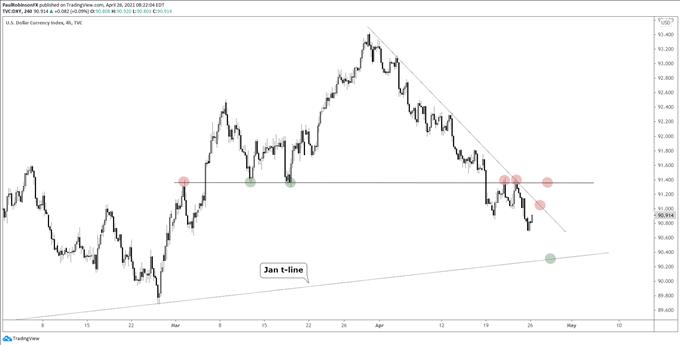
The US Dollar Index (DXY) was knocked lower on Friday yet again, in-line with the trend off the late March peak. It is difficult to fight the current trend, but expect bounces along the way even if the shorter-term trend is the beginning of a longer-term slide.
The first significant area to watch is around the 9130 level, a spot on the chart that has been in play for nearly two months. It began as a point of resistance in early March, then quickly turned to support before once again becoming resistance again last week.
On Wednesday and Thursday we saw the DXY rise up and fail from this now noteworthy level. A rise and test again from here could offer would-be shorts another solid risk/reward entry. A closing print above 9142 would be reason to lay off a short bias.
A rise above resistance may not necessarily warrant a bullish bias given the generally weak trend, but turning neutral may be the prudent move to see if resistance can turn to support. The general tide is against the USD right now, so even a bounce above resistance may only prove transient.
Before arriving at horizontal resistance, there is a slope that is growing in importance that could keep any advance from here contained. For more aggressive shorts, this may offer the first line of resistance to join the trend lower.
Looking lower, there isn't any support until a low-angled trend-line off the early January low; this line currently runs under at roughly 9030. It would be the next spot to look for a bounce to potentially develop from in the event we don't see strength from current levels.
All-in-all, continuing to run with the trend lower, but still need to think tactically about how to take advantage of this bias and understand when it may be time to switch gears. The slope and horizontal levels mentioned above appear to offer solid short-term guides.

US Dollar Index (DXY) Daily Chart (looking towards Feb/Jan lows)

DXY Chart by TradingView
Resources for Forex Traders
Whether you are a new or experienced trader, we have several resources available to help you; indicator for tracking trader sentiment , quarterly trading forecasts , analytical and educational webinars held daily, trading guides to help you improve trading performance, and one specifically for those who are new to forex .
---Written by Paul Robinson, Market Analyst
You can follow Paul on Twitter at @PaulRobinsonFX
MENAFN26042021000076011015ID1101985978
Legal Disclaimer:
MENAFN provides the information “as is” without warranty of any kind. We do not accept any responsibility or liability for the accuracy, content, images, videos, licenses, completeness, legality, or reliability of the information contained in this article. If you have any complaints or copyright issues related to this article, kindly contact the provider above.