(MENAFN- Daily Forex) Long Trade IdeaEnter your long position between $23.13 (the lower band of its horizontal support zone) and $24.11 (yesterday's intra-day high).Top Regulated Brokers1 Get Started 74% of retail CFD accounts lose money Market Index Analysis Comcast (NASDAQ:CMCSA) is a member of the NASDAQ 100 Index, the S&P 100 Index, and the S&P 500 Index. All three indices trade near all-time highs with rising bearish catalysts and worsening macroeconomic headwinds. The Bull Bear Power Indicator for the S&P 500 Index is bearish with a descending trendline.
Market Sentiment AnalysisEquity futures are moving higher, building on yesterday's advance following Friday's one-day plunge. AI is leading the way again, boosted after Marvell Technology's (NASDAQ:MRVL) inclusion into the S&P 500 and OpenAI's announcement that it has taken the first step towards its IPO. Inflationary pressures continue amid the war in Iran, while the SpaceX IPO is oversubscribed, with $150 billion in orders for $75 billion in shares, and worries over a potential market top have increased because of the blockbuster listing Fundamental AnalysisComcast is a media and entertainment conglomerate. It is also the world's fourth largest media company measured by revenue. In the US, it is the third-largest pay TV company, the second-largest cable TV company, and the largest internet service provider.So, why am I bullish on CMCSA despite its correction?While Comcast's streaming service Peacock continues to incur losses, those losses are decreasing. It now has over 46 million subscribers and generates over $2 billion in revenue. Management guides towards profitability in the second or third quarter of this year. Valuations remain extremely low, and I am also bullish on the expectation that a significant number of its 9 million wireless line users will become paid subscribers.
| Metric | Value | Verdict |
| P/E Ratio | 4.66 | Bullish |
| P/B Ratio | 0.96 | Bullish |
| PEG Ratio | 1.43 | Bullish |
| Current Ratio | 0.87 | Bearish |
| ROIC-WACC Ratio | Positive | Bullish The price-to-earnings (P/E) ratio of 4.66 makes CMCSA an inexpensive stock. By comparison, the P/E ratio for the S&P 500 Index is 31.90.The average analyst price target for CMCSA is $32.45. This suggests excellent upside potential with reasonable downside risks Technical AnalysisToday's CMCSA Signal
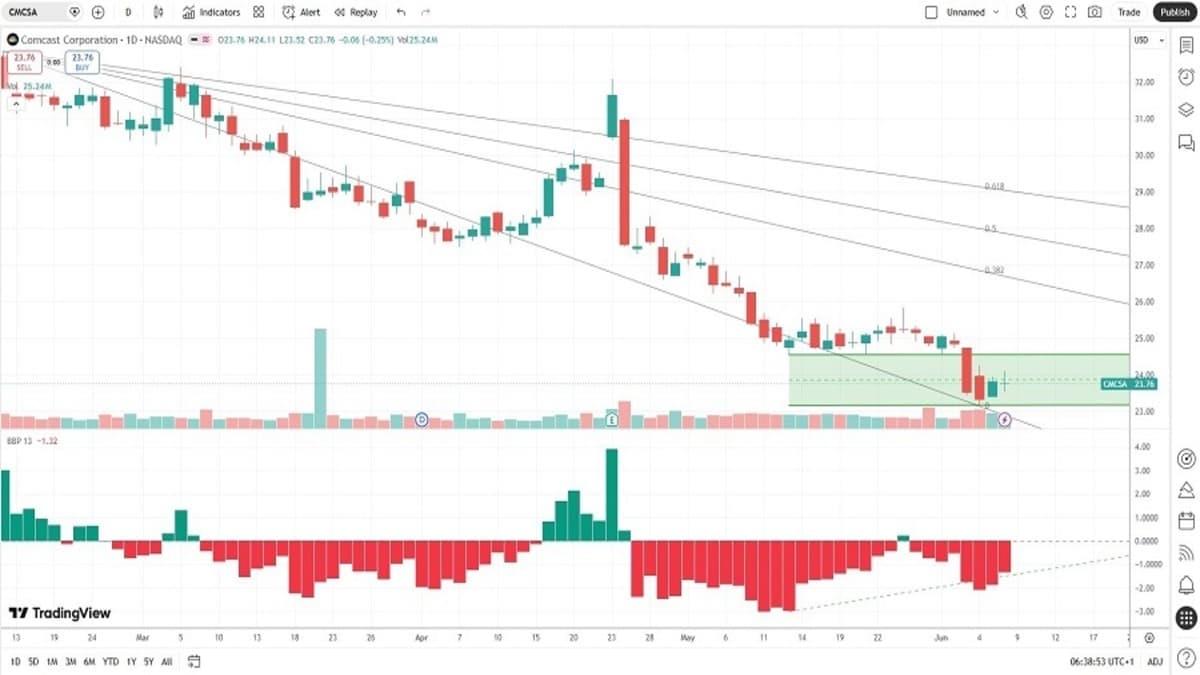
The CMCSA D1 chart shows price action inside a horizontal support zone. It also shows price action between its descending 0.0% and 38.2% Fibonacci Retracement Fan levels. The Bull Bear Power Indicator is bearish with a positive divergence. The average bearish trading volumes are higher than the average bullish trading volumes, hinting at potentially more short-term volatility. CMCSA dropped by more than the S&P 500 Index, a bearish confirmation, but breakout catalysts are rising. My CMCSA Long Stock Trade CMCSA Entry Level: Between $23.13 and $24.11 CMCSA Take Profit: Between $30.14 and $31.03 CMCSA Stop Loss: Between $20.65 and $21.70 Risk/Reward Ratio: 2.83 Ready to trade our analysis of Comcast? Here is our list of the best stockbrokers worth reviewing. |
MENAFN09062026000131011023ID1111234766
Legal Disclaimer:
MENAFN provides the
information “as is” without warranty of any kind. We do not accept
any responsibility or liability for the accuracy, content, images,
videos, licenses, completeness, legality, or reliability of the information
contained in this article. If you have any complaints or copyright
issues related to this article, kindly contact the provider above.


Comments
No comment