


403
Sorry!!
Error! We're sorry, but the page you were looking for doesn't exist.
Gold Holds $5,055, Silver Surges 3.8% Ahead Of NFP
| Instrument | Last | Chg | %Chg |
|---|---|---|---|
| Gold (XAU/USD) | $5,055 | +30 | +0.61% |
| Silver (XAG/USD) | $83.78 | +3.04 | +3.76% |
| Gold/Silver Ratio | 60.3 | −1.9 | −3.1% |
| DXY | 96.80 | −0.83 | −0.85% |
| US 10Y Yield | 4.16% | −0.04 | −0.93% |
| S&P 500 | 6,965 | +33 | +0.47% |
| VIX | 17.76 | +0.31 | +1.78% |
| Brent Crude | $69.11 | +1.06 | +1.56% |
Gold edged higher on Tuesday, closing at $5,055 after briefly touching $5,069 intraday, as softer-than-expected January retail sales data pushed the US dollar lower and reinforced expectations that the Federal Reserve will cut rates at least twice this year.
The DXY index slipped to 96.8, extending its decline below the psychologically important 97 level, while the 10-year Treasury yield fell 3.9 basis points to 4.16%.
China's central bank continued its gold accumulation campaign for a sixteenth consecutive month, with the World Gold Council projecting central bank purchases near 850 tonnes for 2026.
Despite the constructive backdrop, the session was notably subdued - a "snoozer" in the words of OANDA's market wrap - as traders positioned cautiously ahead of Wednesday's delayed Non-Farm Payrolls release.
Silver was the standout performer, surging 3.76% to close at $83.78 - its strongest single-session gain in over a week. The move extends the remarkable recovery from the historic crash that saw prices collapse from the $121 record high on January 29 to lows near $68 in early February.
The Silver Institute released its 2026 outlook, confirming a sixth consecutive annual market deficit with mine production expected at 820 Moz against surging industrial demand from solar panels, electric vehicles, and AI data center infrastructure.
JP Morgan's Global Research team projects silver averaging $81/oz this year - more than double its 2025 average - while Bank of America's long-term structural target of $309 continues to anchor the bull case.
The gold/silver ratio compressed to approximately 60.3, down from 61.5 in the prior session, signaling renewed industrial metal outperformance. Brent crude rose 1.56% to $69.11 as traders monitored US-Iran developments, while the S&P 500 gained 0.47% to close at 6,965.
The VIX ticked up slightly to 17.76, reflecting pre-NFP hedging demand. UBS maintained their view that the late-January sell-off was a "positioning shakeout, not a regime change," while JP Morgan reiterated their year-end gold target of $6,300, describing gold as a "dynamic, multi-faceted portfolio hedge" in the current macro environment.
03Gold - Technical Analysis Daily Chart CFDs on Gold (US$/OZ) · 1D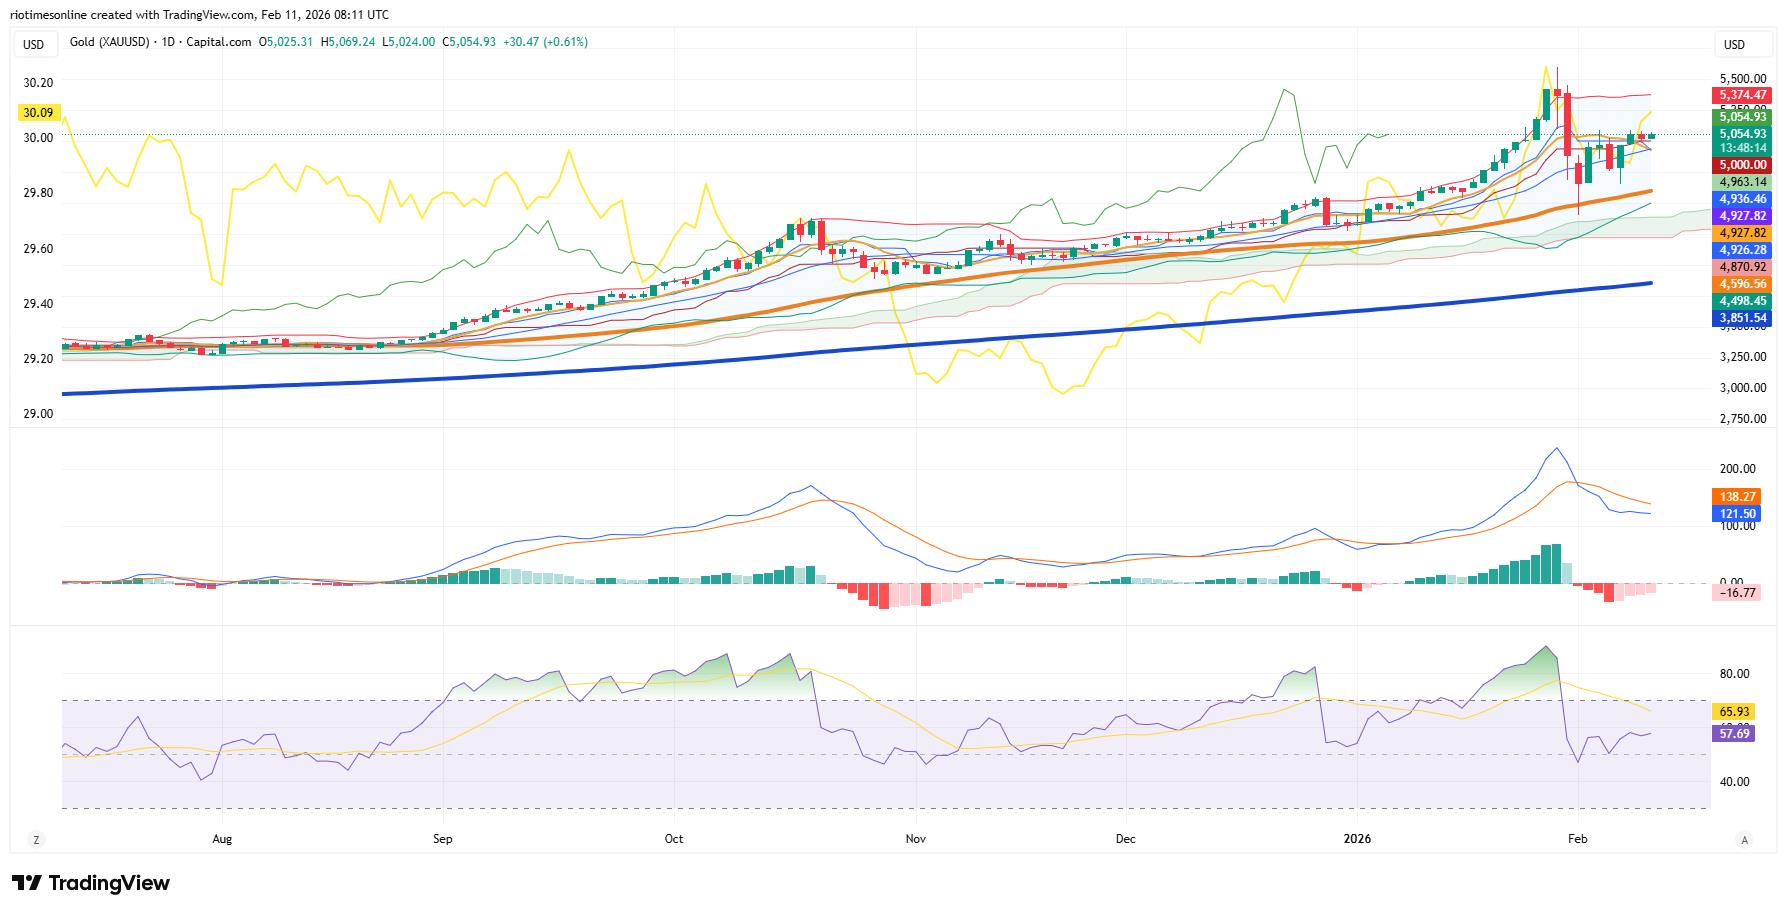
Ichimoku · Bollinger Bands · MACD · RSI Source: TradingView 4-Hour Chart CFDs on Gold (US$/OZ) · 4H
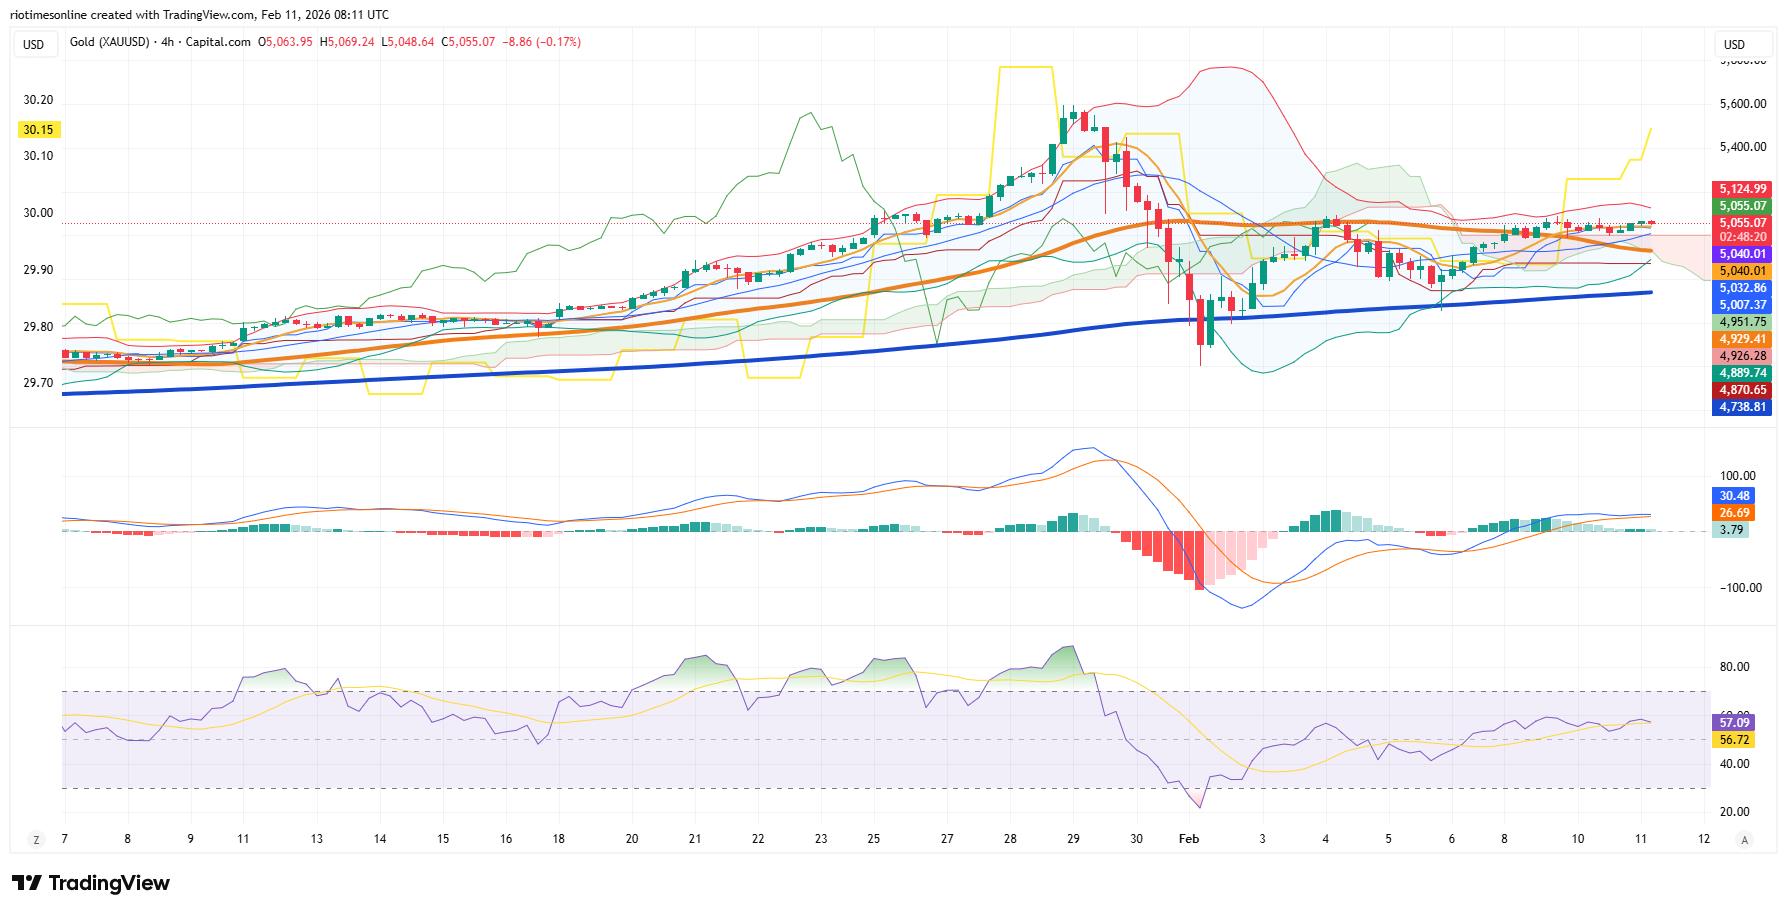
Ichimoku · Bollinger Bands · MACD · RSI Source: TradingView
Daily: Gold closed at $5,055 after a steady session that saw prices trade in a tight $5,024–$5,069 range. The daily Ichimoku cloud remains supportive with price trading well above both the Tenkan-sen and Kijun-sen.
The Bollinger Bands are expanding upward, confirming the bullish trend structure. The daily RSI reads 65.93/57.69 - bullish but not yet overbought, leaving room for further upside. The MACD is positive at 138.27/121.50, though the histogram at −16.77 shows slight momentum deceleration.
The 200-day baseline sits near $4,871, far below current price, confirming the dominant multi-month uptrend. Key resistance at $5,374 (Senkou Span B area), with the all-time high at $5,595 as the ultimate target.
4-Hour: The 4H chart shows gold consolidating near the top of the Ichimoku cloud, with the Senkou Span B at $5,125 acting as near-term resistance. Price is hovering around $5,055, with immediate support at $5,040 and $5,033.
The 4H MACD is positive at 30.48/26.69 with a histogram at 3.79, suggesting mild bullish momentum. The RSI at 57.09/56.72 is neutral - neither overbought nor oversold - indicating the consolidation could resolve in either direction depending on Wednesday's NFP data. A break above $5,125 would open the path to $5,375; a failure below $5,007 would signal a deeper pullback toward $4,927.
| Gold Levels | Price | Note |
|---|---|---|
| Resistance 3 | $5,595 | All-time high (Jan 29) |
| Resistance 2 | $5,374 | Daily Senkou Span B |
| Resistance 1 | $5,125 | 4H Senkou Span B |
| Current Price | $5,055 | Feb 10 session close |
| Support 1 | $5,007 | 4H cloud base / psychological |
| Support 2 | $4,927 | Daily Kijun-sen area |
| Support 3 | $4,739 | Crash low / demand zone |
Ichimoku · Bollinger Bands · MACD · RSI Source: TradingView 4-Hour Chart CFDs on Silver (US$/OZ) · 4H
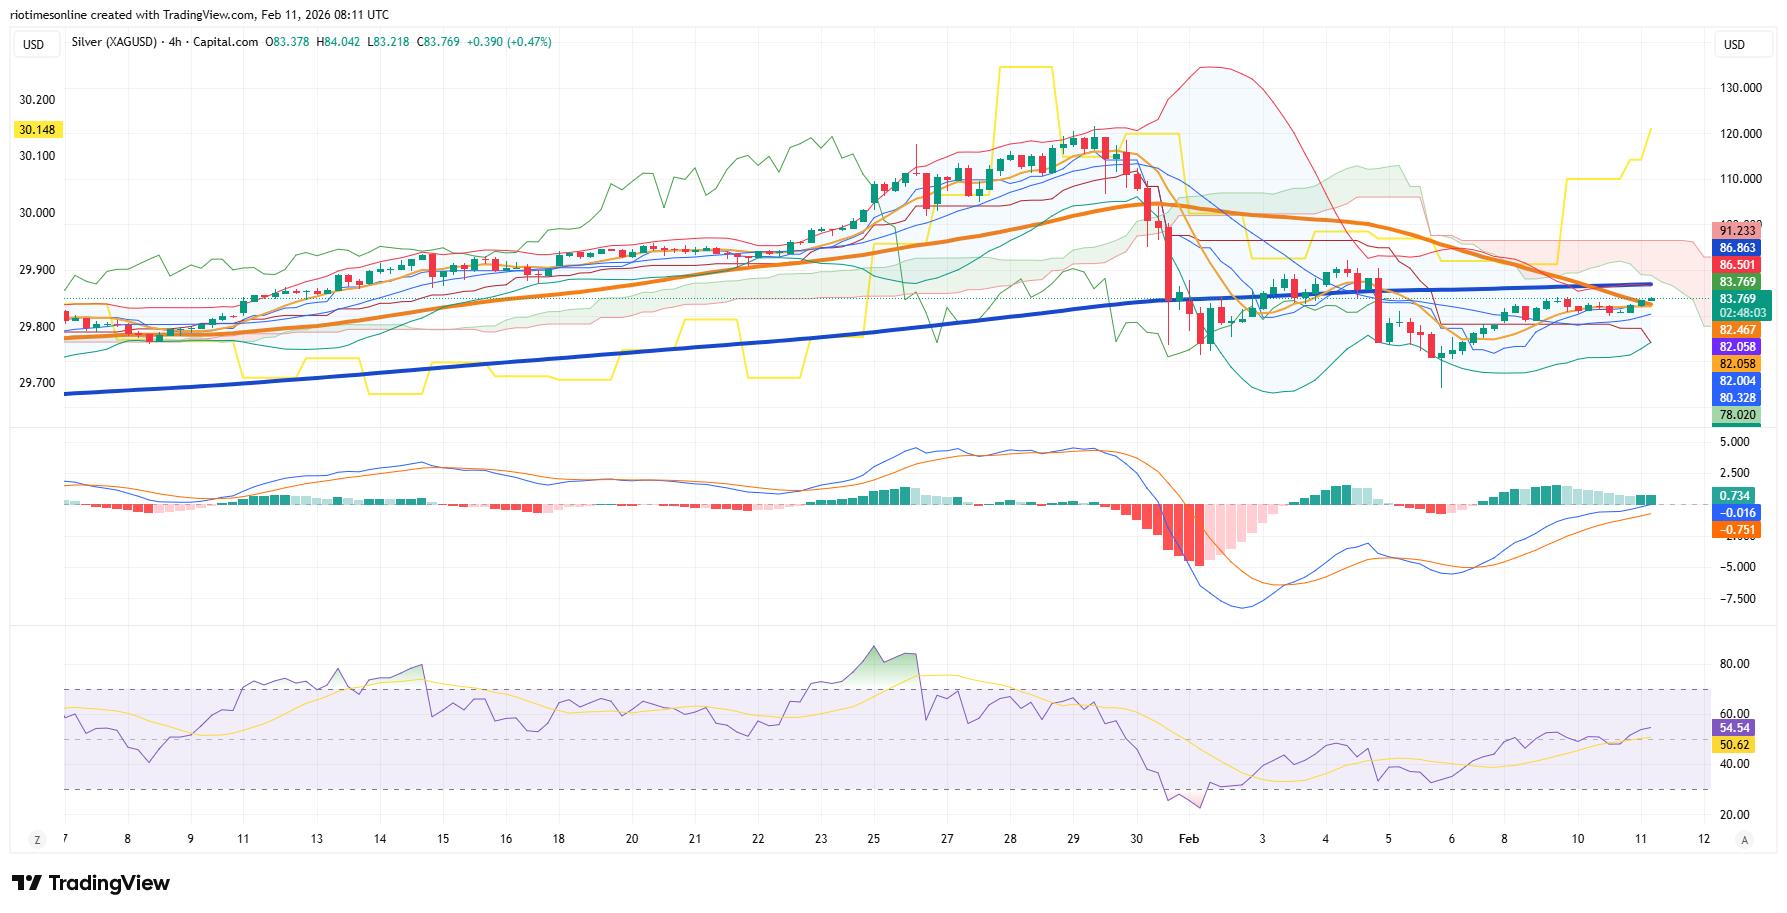
Ichimoku · Bollinger Bands · MACD · RSI Source: TradingView
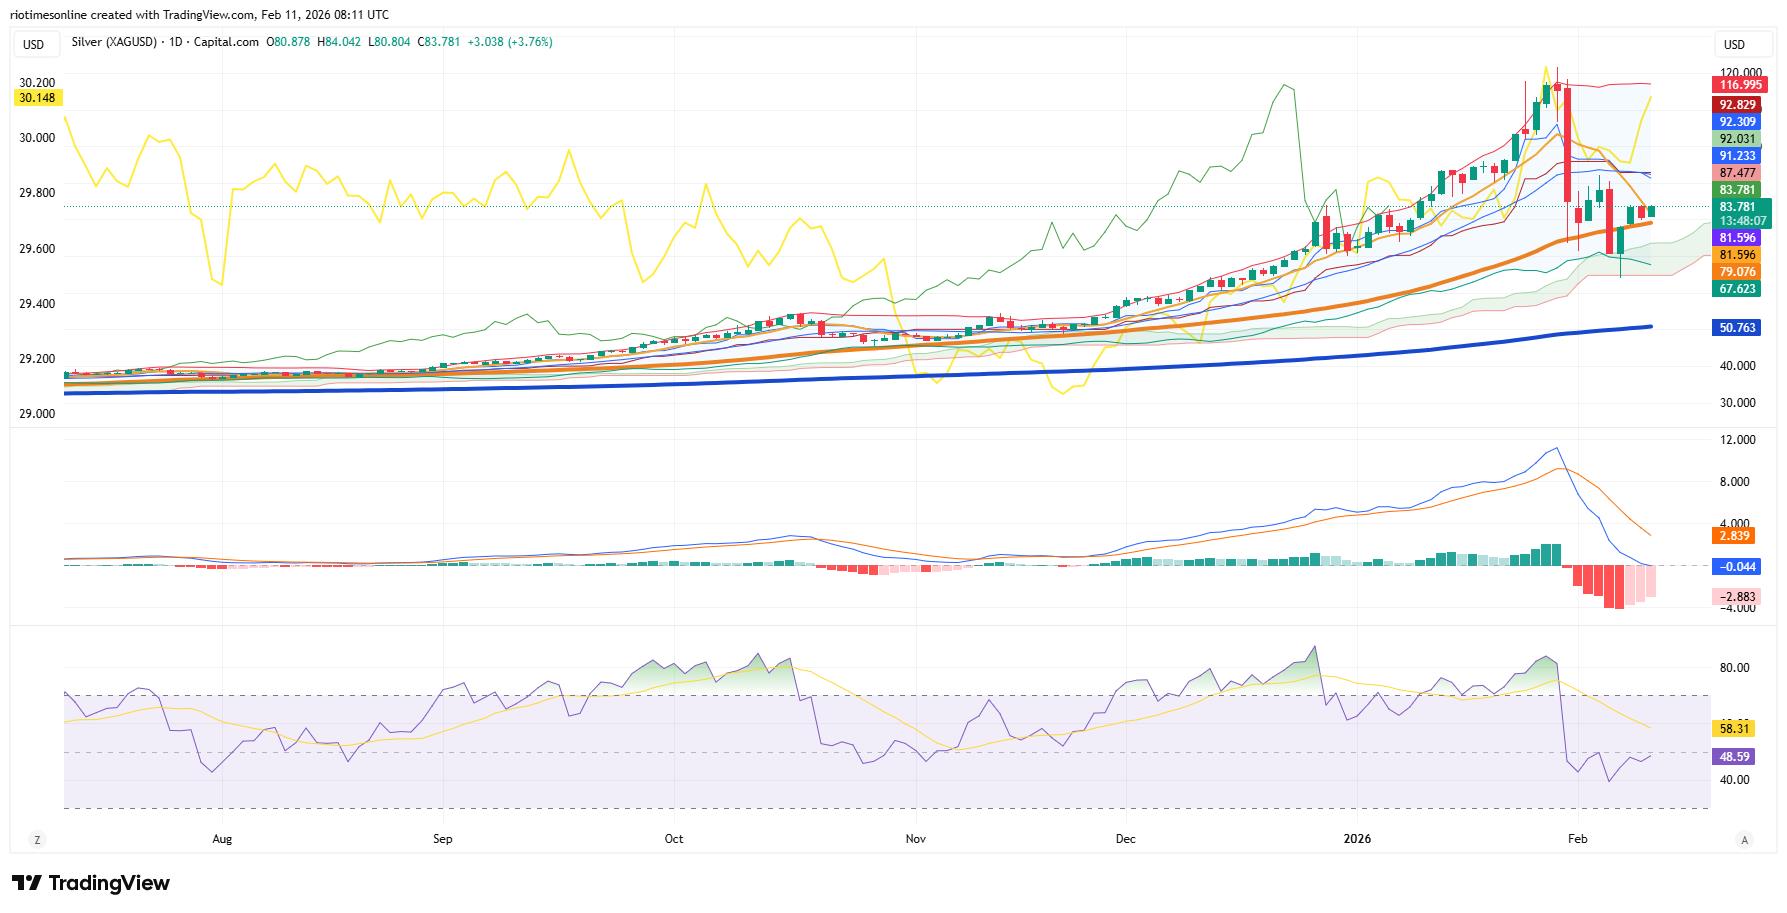
Daily: Silver closed at $83.78 after a powerful 3.76% rally that saw prices surge from an $80.80 low to a $84.04 high. The daily chart shows price has now reclaimed territory above the Ichimoku cloud, a significant technical development after the devastating crash from $121.
The Tenkan-sen and Kijun-sen are converging near $83–$87, setting up a potential bullish crossover. The daily RSI at 58.31/48.59 is improving but not yet confirming a full trend reversal.
The MACD at 2.839/−0.044 is on the verge of crossing positive - the histogram at −2.883 remains negative but is rapidly improving. The 200-day baseline at $50.76 is far below, confirming the massive multi-month advance that preceded the crash. Key resistance at $87.48 (upper Bollinger area) and $92.83 (recent swing high).
4-Hour: The 4H chart shows silver consolidating near $83.77 after the day's rally, trading at the upper edge of the Ichimoku cloud. Immediate resistance sits at $86.50–$86.86 (cloud top and Senkou Span B), with $91.23 as the next major target.
The 4H MACD at 0.734/−0.016 has just crossed positive, with the histogram at −0.751 still negative but improving rapidly. The RSI at 54.54/50.62 is neutral, suggesting the consolidation phase could extend before the next directional move.
Support at $82.06–$82.47 (cloud base), with $80.33 and $78.02 as deeper support levels. A sustained close above $86.50 would confirm the recovery trend; a failure below $80 would reopen downside risk toward the crash lows.
| Silver Levels | Price | Note |
|---|---|---|
| Resistance 3 | $116.99 | All-time high zone (Jan 29) |
| Resistance 2 | $92.83 | Recent swing high / daily cloud top |
| Resistance 1 | $86.86 | 4H Senkou Span B / cloud top |
| Current Price | $83.78 | Feb 10 session close |
| Support 1 | $80.33 | 4H cloud base |
| Support 2 | $78.02 | 4H Senkou Span B lower |
| Support 3 | $67.62 | Crash low / demand zone |
| Bank | Gold Target | Horizon |
|---|---|---|
| JP Morgan | $6,300 | End 2026 |
| Société Générale | $6,000 | Year-end |
| UBS | $5,200+ | Q4 2026 (mid-to-late bull) |
| Bank of America | Silver $309 | Long-term structural target |
| LiteFinance | $4,915–$5,719 | February range |
Tue Feb 11 - Fed Chair Powell Testimony (Day 1) + JOLTS Job Openings
Wed Feb 12 - January NFP (delayed) + Powell Testimony (Day 2)
Thu Feb 13 - Initial Jobless Claims + PPI
Fri Feb 14 - January CPI (delayed) + UMich Consumer Sentiment
VerdictGold: The bull market remains structurally intact. Tuesday's session confirmed that $5,000 continues to act as a firm floor, with the daily chart showing a healthy consolidation above all major moving averages and the Ichimoku cloud.
The macro backdrop is increasingly supportive: the DXY has broken below 97, real yields are falling, and rate-cut expectations are building ahead of what could be a pivotal NFP release.
Central bank demand remains the structural pillar, with China extending purchases for a sixteenth month and the World Gold Council projecting 850 tonnes of official buying in 2026. Gold is coiling for a directional move - the $5,000 floor is the line in the sand.
Upside targets: $5,125 (near-term, 4H Senkou Span B), $5,374 (daily cloud), $5,595 (ATH). Downside risk: a sustained break below $5,000 reopens the $4,739–$4,927 demand zone.
Wednesday's NFP is the binary catalyst - a print below 50K would accelerate rate-cut pricing and likely push gold toward $5,200+; a beat above 140K could trigger a temporary pullback to test $5,000 support.
Silver: The 3.76% surge to $83.78 is the most constructive daily candle since the crash recovery began. Silver has now reclaimed the daily Ichimoku cloud - a significant technical milestone - and the MACD is on the verge of crossing positive for the first time since the January blow-off.
The Silver Institute's confirmation of a sixth consecutive supply deficit (mine production at 820 Moz vs. surging industrial demand) underpins the structural bull case.
However, the technical damage from the 47% crash has not fully healed: the $86.50–$87.50 zone is the recovery confirmation level, and a close above it would re-establish the bullish structure. Below $80, bears regain control.
Position sizing should reflect the extreme volatility regime - annualized vol remains elevated - but the gold/silver ratio compression toward 60 favors silver outperformance if risk appetite holds through this week's data gauntlet.
This report is for informational purposes only and does not constitute investment advice. Past performance is not indicative of future results. Trading precious metals involves substantial risk of loss. Data sourced from TradingView, TradingEconomics, Investing, CNBC, Reuters, MarketPulse, Silver Institute, World Gold Council, and analyst reports cited herein. All prices as of Tuesday February 10, 2026 session close unless otherwise noted.

Legal Disclaimer:
MENAFN provides the
information “as is” without warranty of any kind. We do not accept
any responsibility or liability for the accuracy, content, images,
videos, licenses, completeness, legality, or reliability of the information
contained in this article. If you have any complaints or copyright
issues related to this article, kindly contact the provider above.
Most popular stories
Market Research

More Story


Comments
No comment