403
Sorry!!
Error! We're sorry, but the page you were looking for doesn't exist.
GBP/USD Forex Signal 06/11: Double-Top Forms (Chart)
(MENAFN- Daily Forex) Bearish view
- Sell the GBP/USD pair and set a take-profit at 1.2900. Add a stop-loss at 1.3140. Timeline: 1-2 days.
- Buy the GBP/USD pair and set a take-profit at 1.3140. Add a stop-loss at 1.2900.
More data showed that output in the services sector improved in the US. The ISM non-manufacturing PMI figure rose to 52.4 in October from the previous 50, while another one by S&P Global revealed that the figure rose to 54. A PMI reading of 50 and above is a sign a sector is growing.
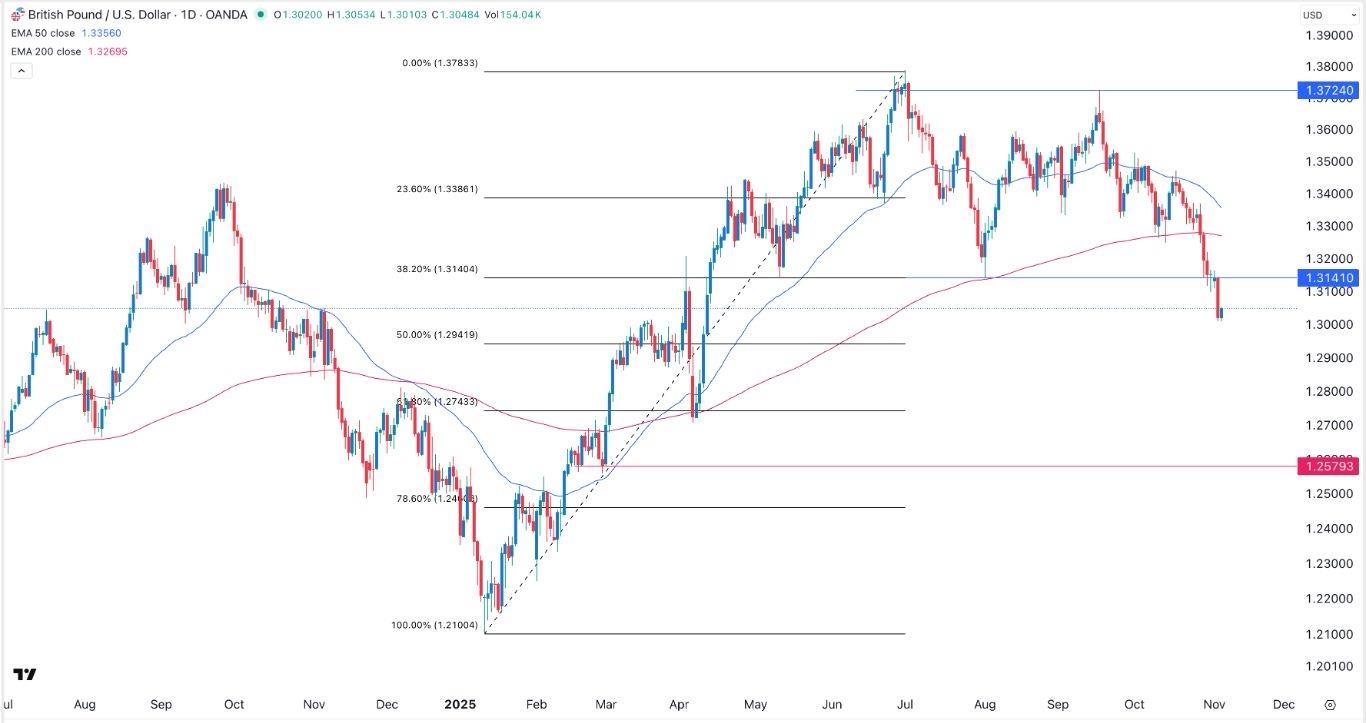
EURUSD Chart by TradingViewGBP/USD Technical AnalysisThe daily timeframe chart shows that the GBP/USD exchange rate has crashed in the past few months, moving from a high of 1.3725 in September to a low of 1.3012 this week.It has moved below the important support level at 1.3140, its lowest level on August 1, the neckline of the double-top pattern at 1.3724. A double-top is one of the most bearish patterns in technical analysis.The pair has moved below the 38.2% Fibonacci Retracement level at 1.3140. Also, it has moved below the 50-day and 200-day Exponential Moving Averages.Therefore, the most likely GBP/USD forecast is bearish, with the next key target being at the 50% retracement level at 1.2940. The alternative is where it rebounds and retests the key resistance level at 1.3141.Ready to trade our free daily Forex trading signals? We've shortlisted the best UK forex brokers in the industry for you
Legal Disclaimer:
MENAFN provides the
information “as is” without warranty of any kind. We do not accept
any responsibility or liability for the accuracy, content, images,
videos, licenses, completeness, legality, or reliability of the information
contained in this article. If you have any complaints or copyright
issues related to this article, kindly contact the provider above.


Comments
No comment