403
Sorry!!
Error! We're sorry, but the page you were looking for doesn't exist.
BTC/USD Signal 02/09: Breakout Spike Price Action (Chart)
(MENAFN- Daily Forex) Today's BTC/USD Signals Long Trade Idea
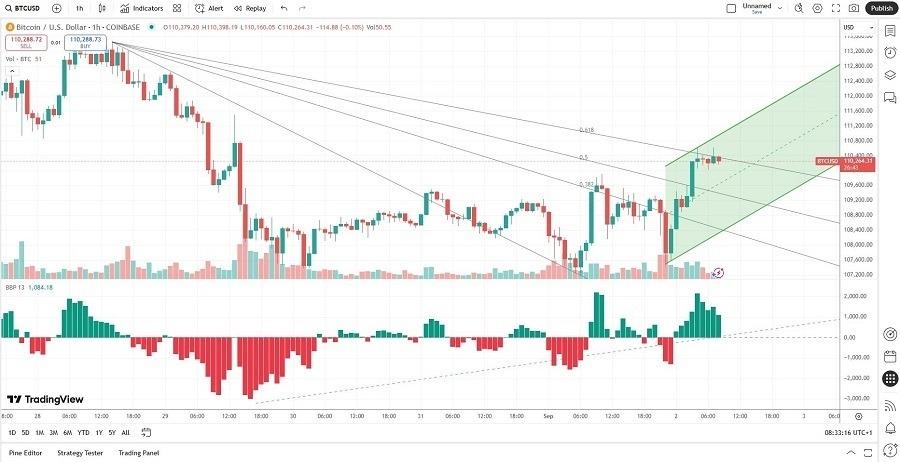
- Long entry between $109,907 and $110,621, the lower and upper bands of a small horizontal support zone that support more upside. Place your stop-loss level at $200 below your entry level. Adjust the stop-loss to break even once the trade is $500 in profit. Take off 50% of the position as profit when the price reaches $500 in profit and leave the remainder of the position to run.
- Short entry if price action breaks down below $109,407, $500 below the lower band of its horizontal support zone. Place your stop-loss level $200 above your entry level. Adjust the stop-loss to break even once the trade is $500 in profit. Take off 50% of the position as profit when the price reaches $500 in profit and leave the remainder of the position to run.
- Over the past 24 hours, X has shown 49.33% of bullish Bitcoin tweets versus 25.55% of bearish Bitcoin tweets from 162,786 tweets. Over the past 24 hours, Reddit featured 9,754 Bitcoin posts with 73,139 comments. The posts received fewer upvotes than downvotes by the community, but the comments received more upvotes than downvotes. Long-term Bitcoin holders have liquidated positions, but Bitcoin overcame the selling pressure to power forward.
A potential flag chart pattern is forming, a bullish continuation pattern, which could lead to a spike in price action following a breakout. Crypto traders should get $500 to $750 from this long position, but it could magnify with a breakout above the 61.8% Fibonacci Retracement Fan.
EURUSD Chart by TradingViewReady to trade our free crypto signals? Check out our list of the best MT4 crypto brokers.
Legal Disclaimer:
MENAFN provides the
information “as is” without warranty of any kind. We do not accept
any responsibility or liability for the accuracy, content, images,
videos, licenses, completeness, legality, or reliability of the information
contained in this article. If you have any complaints or copyright
issues related to this article, kindly contact the provider above.


Comments
No comment