GBP/USD Forex Signal 13/08: Flips Key Resistance (Chart)
-
Buy the GBP/USD pair and set a take-profit at 1.3600.
Add a stop-loss at 1.3400.
Timeline: 1-2 days.
-
Sell the GBP/USD pair and set a take-profit at 1.3400.
Add a stop-loss at 1.3600.
The GBP/USD pair jumped as the US Dollar Index (DXY) retreated to a two-month low after the latest US inflation data. It jumped to a high of 1.3525, much higher than last week's low of 1.3143.
Federal Reserve Interest Rate BetsEconomists have boosted their bets that the Federal Reserve will cut interest rates in the coming meeting in the September meeting. These odds started to jump earlier this month after the Bureau of Labor Statistics (BLS) published weak nonfarm payrolls (NFP) data.
The numbers showed that the economy created just 73,000 jobs as the unemployment rate rose to 4.2%. Worse, the bureau downscaled the jobs created in the previous month to an average of 35,000, the worst figure since the pandemic.
The odds of rate cuts then escalated on Tuesday after the US published the latest consumer price index (CPI) data. The headline consumer price index (CPI) remained unchanged at 2.7%, while the core figure rose from 2.9% to 3.1% during the month.
The CME Fed Rate monitor tool shows that the odds of a 0.25% cut in September rose to over 90%. These odds have jumped as the country's inflation did not rise as much as analysts were expecting. Also, goods inflation was still subdued, as services figure jumped. A 0.25% cut will bring the official cash rate from the current range to between 4% and 4.25%.
Top Forex Brokers 1 Get Started 74% of retail CFD accounts lose money " class="fui-Primitive ___16zla5h f1oy3dpc fqtknz5 fyvcxda" dir="auto" id="content-1686574122635"> Top Forex Brokers 1 Get Started 74% of retail CFD accounts lose money
The next important driver for the GBP/USD pair will be the upcoming mortgage data and statements by some Fed officials like Austan Goolsbee, Raphael Bostic, and Tom Barkin.
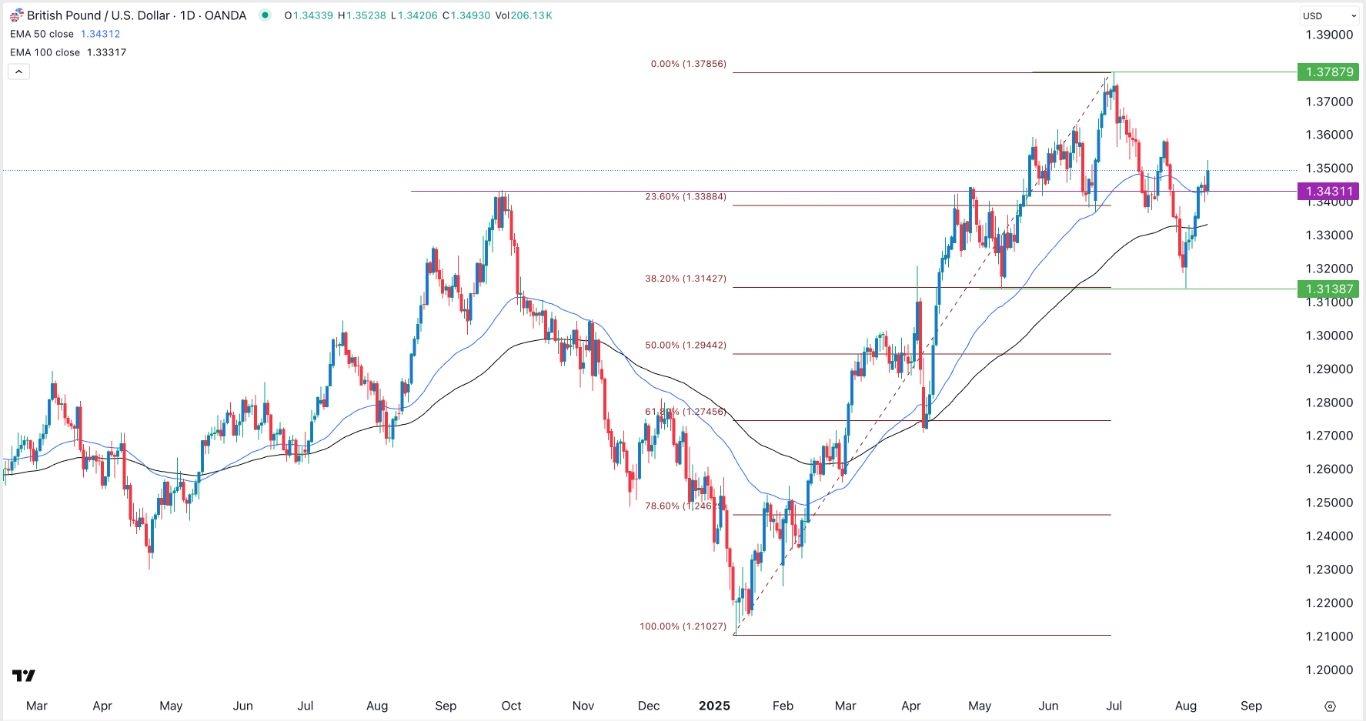
EURUSD Chart by TradingView GBP/USD Technical AnalysisThe daily chart shows that the GBP/USD pair crashed to a low of 1.3138 on August 1 and is currently 1.3500. This rebound happened after the pair formed a bullish engulfing pattern, which consists of a big bullish candle that follows and covers a small bearish candle.
The pair has moved above the 23.6% Fibonacci Retracement level at 1.3388 and the key resistance level at 1.3431, the highest swing on September 26. It also jumped above the 50-day and 100-day moving averages.
Therefore, it will likely continue rising as bulls target the psychological point at 1.3600. A drop below the support at 1.3430 will invalidate the bullish outlook.

Legal Disclaimer:
MENAFN provides the
information “as is” without warranty of any kind. We do not accept
any responsibility or liability for the accuracy, content, images,
videos, licenses, completeness, legality, or reliability of the information
contained in this article. If you have any complaints or copyright
issues related to this article, kindly contact the provider above.


Comments
No comment